INVITE-ONLY SCRIPT
Supply and Demand Zone Indicator
Обновлено
OVERVIEW
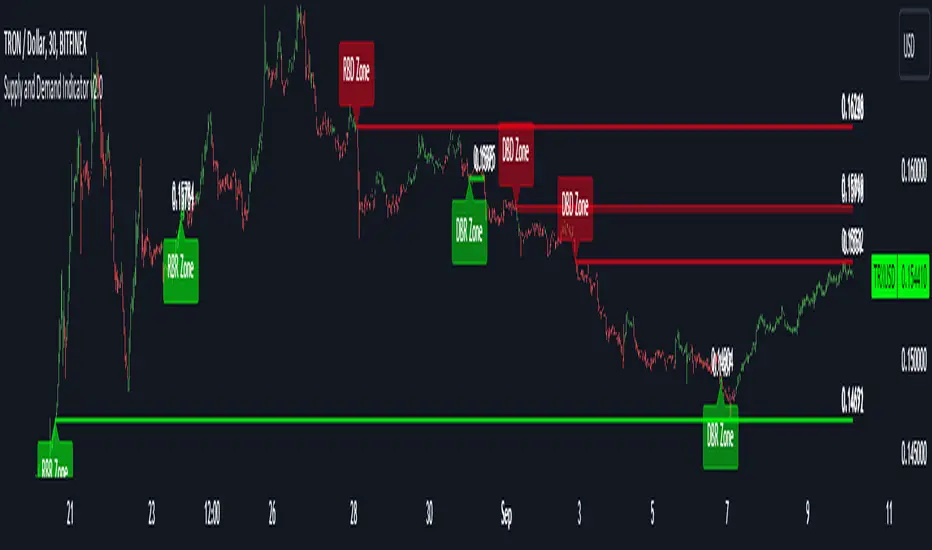
The supply and demand zone indicator shows real-time supply and demand zones on the chart. It also plots a table including the high and low values of the zones. The last row of the table also shows the daily trend in the market.
CONCEPTS
What is Supply & Demand?
Supply and Demand represent the two most powerful forces of the forex market. Demand means the number of buyers buying a security in the market. Supply means the number of sellers selling a security in the market.
How to identify supply and demand zones?
Supply and Demand zones are formed on the base region of price on the chart. There are two types of movement of price in technical analysis.

The impulsive wave represents the price movement of market makers. The Retracement wave indicates base regions where market makers decide their next direction to go up or down.
There are four fundamental concepts of Demand and supply in forex.
How does supply & demand indicator work?
Our supply & demand indicator will use a simple formula based on price action to plot the zones. It will plot the zone on the base candles using the high and low of the base zone.
Base candle = a candlestick that has a small body and big shadows like a Doji candlestick.
Big candle = a candlestick with a large body and small shadows.
The zone will be drawn on the high and low of the base candlestick. There can be more than one base candlesticks in the base zone, but our indicator will identify the maximum of 4 base candlesticks.
FEATURES
The supply and demand zone indicator shows real-time supply and demand zones on the chart. It also plots a table including the high and low values of the zones. The last row of the table also shows the daily trend in the market.
CONCEPTS
What is Supply & Demand?
Supply and Demand represent the two most powerful forces of the forex market. Demand means the number of buyers buying a security in the market. Supply means the number of sellers selling a security in the market.
How to identify supply and demand zones?
Supply and Demand zones are formed on the base region of price on the chart. There are two types of movement of price in technical analysis.
- Impulsive wave
- Retracement wave
The impulsive wave represents the price movement of market makers. The Retracement wave indicates base regions where market makers decide their next direction to go up or down.
There are four fundamental concepts of Demand and supply in forex.
- Rally Base Rally (RBR)
- Rally Base Drop (RBD)
- Drop Base Rally (DBR)
- Drop Base Drop (DBD)
How does supply & demand indicator work?
Our supply & demand indicator will use a simple formula based on price action to plot the zones. It will plot the zone on the base candles using the high and low of the base zone.
Base candle = a candlestick that has a small body and big shadows like a Doji candlestick.
Big candle = a candlestick with a large body and small shadows.
The zone will be drawn on the high and low of the base candlestick. There can be more than one base candlesticks in the base zone, but our indicator will identify the maximum of 4 base candlesticks.
FEATURES
- Specify desired Big Body Candle Size Percentage
- Specify desired Small Body Candle Size Percentage
- Change the Colors of Zones at your own will
- The Indicator Draws the latest zones and puts a label on historical Zones
- The Indicator Draws real-time Zones under specified conditions of candle body sizes. The Zone will stop once the candlestick closes above the supply zone or below demand zones.
Recommended Timeframe
Above 30 Minutes
Информация о релизе
In this update, we have updated the real-time alerts function. Информация о релизе
Alert Updated Информация о релизе
Zones UpdatedИнформация о релизе
Alerts and Zones UpdatedИнформация о релизе
Drawings UpdatedИнформация о релизе
In this version we have improved the loading time of the indicator and now the indicator works much faster. Информация о релизе
Visuals UpdatedИнформация о релизе
Supply and Demand Indicator v2.0 is a powerful tool designed to help traders identify high-probability trading opportunities by focusing on zones where institutional pending orders are likely present. These supply and demand zones offer insight into potential market turning points, allowing traders to capture profitable moves with precision.Key Settings:
- Customizable Candlestick Sizes: Adjust the size of base and big candlesticks to test and adapt your strategy in various market conditions.
- Dynamic Zone Color Control: Change the colors of supply and demand zones, as well as the high and low price, for better visual clarity.
- Selective Zone Visibility: Toggle specific supply and demand zones on or off based on your trading bias. For example, if you're trading in a bullish trend, you can focus solely on demand zones like Rally Base Rally (RBR) and Drop Base Rally (DBR).
- Psychological Indicator for Exits: Our unique psychological indicator helps you find optimal exit points by showing color changes in candlesticks. For sell trades, exit when the color shifts from red to green; for buy trades, exit when green changes to red. This is designed to improve your profit-taking decisions by aligning with market sentiment.
- Higher Timeframe Adaptability: Adjust the psychological indicator to reflect higher timeframes, allowing you to capture larger market trends while executing short-term trades.
Trading Strategy:
Rally Base Rally (RBR) - Buy from a Demand Zone:
- Pattern: A bullish rally followed by a base of smaller candles, and another rally.
- Execution: Set a buy limit order slightly above the high of the base region, with a stop loss below the low.
Drop Base Drop (DBD) - Sell from a Supply Zone:
- Pattern: A bearish drop followed by a base, and another drop.
- Execution: Place a sell limit order slightly below the low of the supply zone, with a stop loss above the high.
Rally Base Drop (RBD) - Sell into a Supply Zone:
- Pattern: A bullish rally followed by a base, and then a bearish drop.
- Execution: Set a sell limit order below the low of the base, with a stop loss above the high.
Drop Base Rally (DBR) - Buy from a Demand Zone:
- Pattern: A bearish drop followed by a base, transitioning into a bullish rally.
- Execution: Place a buy limit order above the high of the demand zone, with a stop loss below the low.
Take Profit Strategy:
For trade exits, rely on the psychological indicator:
Exit sell trades when the color changes from red to green.
Exit buy trades when the color changes from green to red.
Note: Always base your entries on supply and demand zones and not on the psychological indicator. The psychological colour indicator is designed to assist with exit decisions only, not for trade entries.
Additional Tools and Course:
Included with this indicator is a comprehensive course on supply and demand trading. This course will teach you how to utilize the indicator effectively and enhance your overall trading strategy, helping you master these zones and optimize profit-taking techniques.
To get course visit our website Forexbee.
Информация о релизе
Alert Conditions FixedСкрипт с ограниченным доступом
Доступ к этому скрипту разрешён только для пользователей, авторизованных автором, и для этого обычно требуется оплата. Вы можете добавить скрипт в список избранных, но использовать его можно будет только после запроса на доступ и получения разрешения от автора. Свяжитесь с ForexBee, чтобы узнать больше, или следуйте инструкциям автора ниже.
TradingView не советует платить за скрипт и использовать его, если вы на 100% не доверяете его автору и не понимаете, как он работает. Часто вы можете найти хорошую альтернативу с открытым исходным кодом бесплатно в нашем разделе Скрипты сообщества.
Инструкции от автора
″To Get instant access visit the Link Below.
https://forexbee.co/supply-and-demand-indicator/
Leave a thumbs up '👍' to Stay Up to date.
Хотите использовать этот скрипт на графике?
Внимание: прочтите это перед тем, как запросить доступ.
ForexBee
Отказ от ответственности
Все виды контента, которые вы можете увидеть на TradingView, не являются финансовыми, инвестиционными, торговыми или любыми другими рекомендациями. Мы не предоставляем советы по покупке и продаже активов. Подробнее — в Условиях использования TradingView.