OPEN-SOURCE SCRIPT
Channel of linear regression of rate of change from the mean
Обновлено
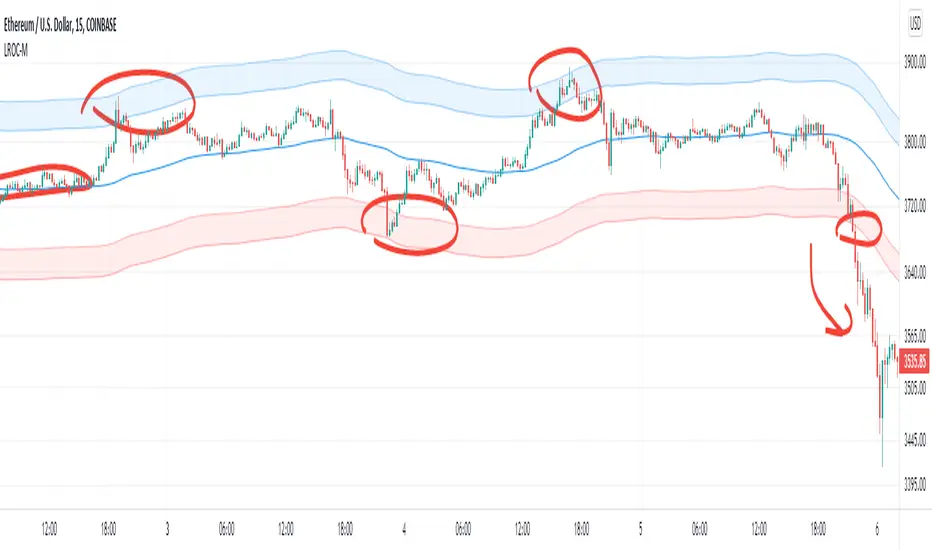
The indicator calculates the difference between the closing price and the average as a percentage and after that it calculates the average linear regression and then draws it in the form of a channel.
Preferably use it on 30 min or 15 min or 1 Hour or 2H time frames .
Exiting outside the upper or lower channel limits represents high price inflation, and returning inside the channel means the possibility of the price rising or falling for the average or the other limit of the channel.
Channel lines may represent places of support and resistance.
Информация о релизе
Some important modifications !Информация о релизе
Full Updates !Скрипт с открытым кодом
В истинном духе TradingView автор этого скрипта опубликовал его с открытым исходным кодом, чтобы трейдеры могли понять, как он работает, и проверить на практике. Вы можете воспользоваться им бесплатно, но повторное использование этого кода в публикации регулируется Правилами поведения. Вы можете добавить этот скрипт в избранное и использовать его на графике.
Отказ от ответственности
Все виды контента, которые вы можете увидеть на TradingView, не являются финансовыми, инвестиционными, торговыми или любыми другими рекомендациями. Мы не предоставляем советы по покупке и продаже активов. Подробнее — в Условиях использования TradingView.