OPEN-SOURCE SCRIPT
Harris RSI
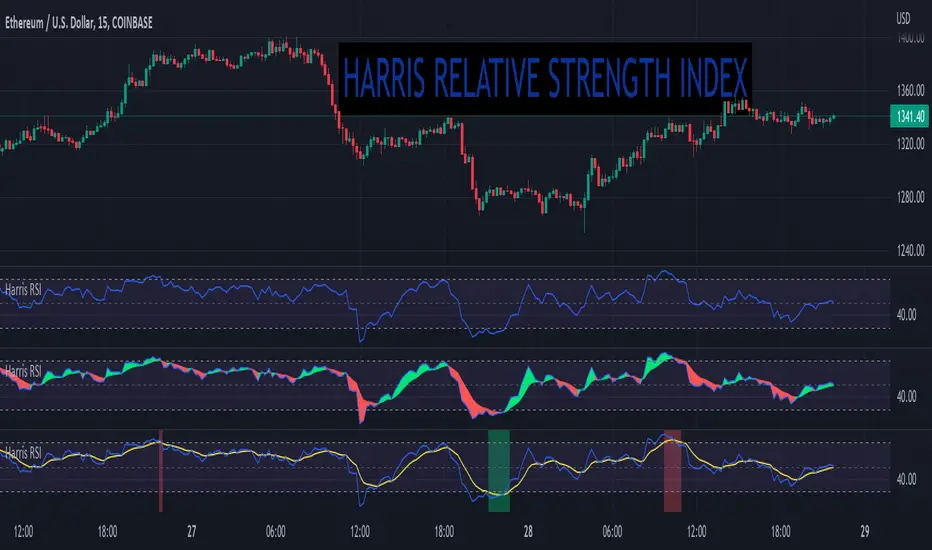
This is a variation of Wilder's RSI that was altered by Michael Harris.
CALCULATION
I have added some signals and filtering options with moving averages:
The signals I added are just some potential ideas, always backtest your own strategies.
CALCULATION
- The average change of each of the length's source value is compared to the more recent source value.
- The average difference of both positive or negative changes is found.
- The range of 100 is divided by the divided result of the average incremented and decremented ratio plus one.
- This result of the above is subracted from the range value of 100
I have added some signals and filtering options with moving averages:
- Trend OB/OS: Uptrend after above Overbought Level. Downtrend after below Oversold Level\n(For the traditional RSI OB=60 and OS=40 is used)
- OB/OS: When above Overbought, or below oversold
- 50-Cross: Above 50 line is uptrend, below is downtrend
- Direction: Moving up or down
- RSI vs MA: RSI above MA is an uptrend, RSI below MA is a downtrend
The signals I added are just some potential ideas, always backtest your own strategies.
Скрипт с открытым кодом
В истинном духе TradingView автор этого скрипта опубликовал его с открытым исходным кодом, чтобы трейдеры могли понять, как он работает, и проверить на практике. Вы можете воспользоваться им бесплатно, но повторное использование этого кода в публикации регулируется Правилами поведения. Вы можете добавить этот скрипт в избранное и использовать его на графике.
tanhef.com/
Scripts and content from TanHef are solely for information and education. Past performance does not guarantee of future results.
Scripts and content from TanHef are solely for information and education. Past performance does not guarantee of future results.
Отказ от ответственности
Все виды контента, которые вы можете увидеть на TradingView, не являются финансовыми, инвестиционными, торговыми или любыми другими рекомендациями. Мы не предоставляем советы по покупке и продаже активов. Подробнее — в Условиях использования TradingView.