OPEN-SOURCE SCRIPT
RSI+OBV
Обновлено
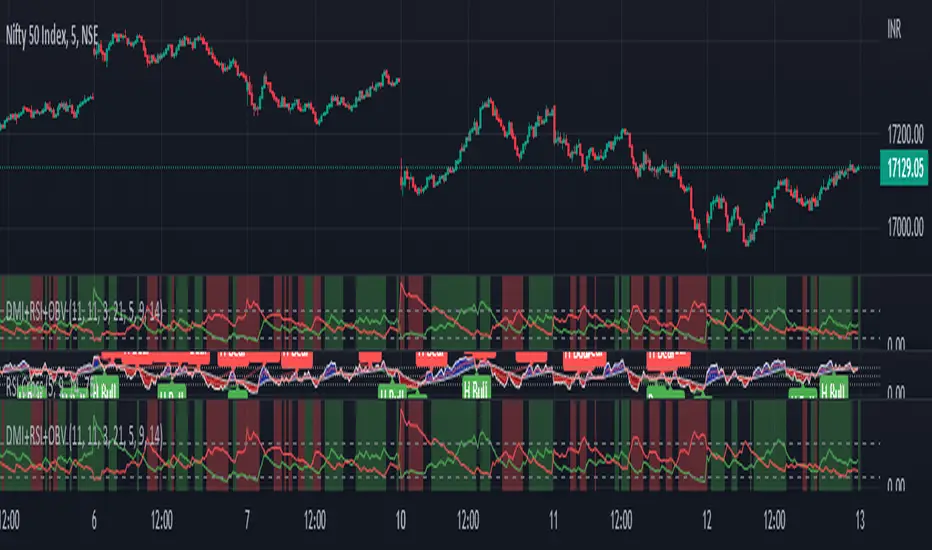
this strategy works on the basis of crossovers of RSI at different period and OBV at different periods (separately). I am using it for Nifty and Bank Nifty. Entry for long can be taken when green bar appears; and exit has to be done when it disappears. Entry for short has to be taken when red bar appears; and exit has to be done when it disappears.
With little help from price action good results can be achieved.
With little help from price action good results can be achieved.
Информация о релизе
this strategy works on the basis of crossovers of RSI at different period and OBV at different periods (separately). I am using it for Nifty and Bank Nifty . Entry for long can be taken when green bar appears; and exit has to be done when it disappears. Entry for short has to be taken when red bar appears; and exit has to be done when it disappears.With little help from price action good results can be achieved.
Update: OBV length has been changed from 2 to 3 and second RSI length has been changed from 11 to 9.
Информация о релизе
this strategy works on the basis of crossovers of RSI at different period and OBV at different periods (separately). I am using it for Nifty and Bank Nifty . Entry for long can be taken when green bar appears; and exit has to be done when it disappears. Entry for short has to be taken when red bar appears; and exit has to be done when it disappears.With little help from price action good results can be achieved.
Update: green and red bars have been changed to green and red background. DMI indicator has also been added to identify the breakouts.
Update1: chart updated
Скрипт с открытым кодом
В истинном духе TradingView автор этого скрипта опубликовал его с открытым исходным кодом, чтобы трейдеры могли понять, как он работает, и проверить на практике. Вы можете воспользоваться им бесплатно, но повторное использование этого кода в публикации регулируется Правилами поведения. Вы можете добавить этот скрипт в избранное и использовать его на графике.
Отказ от ответственности
Все виды контента, которые вы можете увидеть на TradingView, не являются финансовыми, инвестиционными, торговыми или любыми другими рекомендациями. Мы не предоставляем советы по покупке и продаже активов. Подробнее — в Условиях использования TradingView.