PROTECTED SOURCE SCRIPT
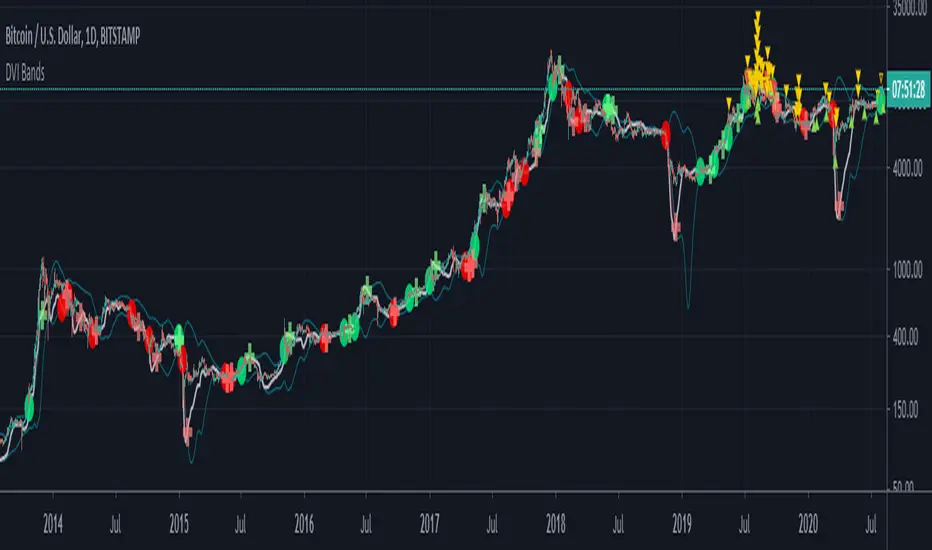
DVI Bands
Обновлено
A new idea of mine that I am presently experimenting on for my trades.
The DVI bands is based on my previously published DVI script:

The Directional Volume Index (DVI) is defined as follows:
DVI = VWMA (len1) - SMA (len2), where by default, len1==len2
The stdev band is derived from the DVI where:
* The DVI piercing the Stdev boundary suggests a significant move in the corresponding direction.
* Tightening of the DVI-Stdev bands can suggest the possible incoming of major move ahead.
The novel aspects and principles of this indicator and this source code are the property of © cybernetwork.
The DVI bands is based on my previously published DVI script:
The Directional Volume Index (DVI) is defined as follows:
DVI = VWMA (len1) - SMA (len2), where by default, len1==len2
- The position of the DVI above/below the current price provides volume confirmation of the direction of the price trend.
- The magnitude of the DVI above/below the current price provides the volume confirmation of the strength of the price trend.
The stdev band is derived from the DVI where:
* The DVI piercing the Stdev boundary suggests a significant move in the corresponding direction.
* Tightening of the DVI-Stdev bands can suggest the possible incoming of major move ahead.
The novel aspects and principles of this indicator and this source code are the property of © cybernetwork.
Информация о релизе
- Introduced markers to indicate points where the DVI pierces above/below the upper/lower DVI-Band.
Информация о релизе
Adjusted markers plot position.Информация о релизе
Changed default analysis length.Информация о релизе
Adjusted size and transparency of crossover markers.Информация о релизе
Updated vwma smoothing default.Информация о релизе
Script now allows users to select the carrier MA mode onto which the DVI is superimposed.Информация о релизе
Added linreg carrier mode.Отказ от ответственности
Все виды контента, которые вы можете увидеть на TradingView, не являются финансовыми, инвестиционными, торговыми или любыми другими рекомендациями. Мы не предоставляем советы по покупке и продаже активов. Подробнее — в Условиях использования TradingView.