OPEN-SOURCE SCRIPT
Broadening Formations [QuantVue]
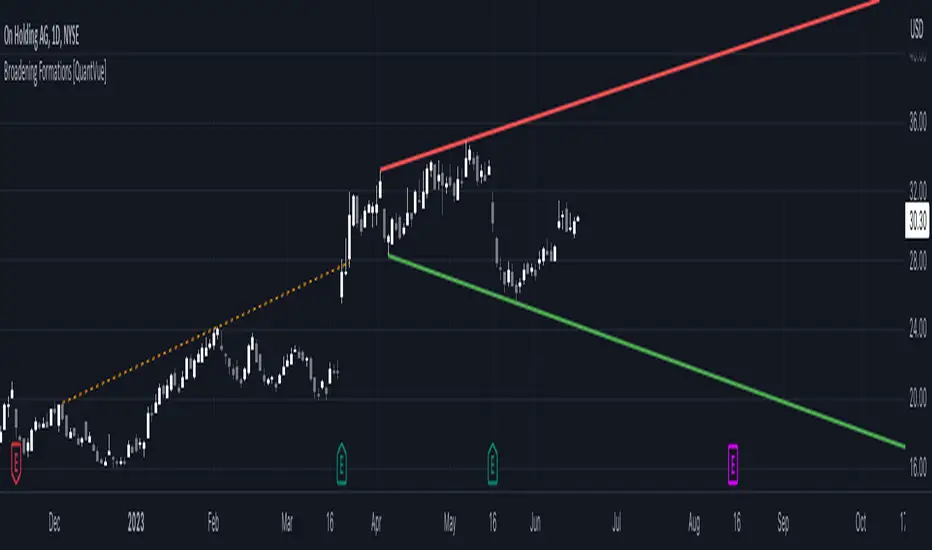
Broadening formations are common chart patterns observed by technical traders. A broadening formation is formed when the volatility of an asset increases, thus expanding the range of its price resulting in higher highs and lower lows.
The Broadening Trendline indicator, works by looking for pivot points where a higher high or lower low is made compared to the previous pivot point. If a top and bottom line are detected a broadening formation is formed.
Indicator includes alerts, custom colors and styles, the ability to see previous trendlines, and notifications when a trendline is crossed.
Don't hesitate to reach out with any questions or concerns.
We hope you enjoy!
Cheers.
Скрипт с открытым кодом
В истинном духе TradingView автор этого скрипта опубликовал его с открытым исходным кодом, чтобы трейдеры могли понять, как он работает, и проверить на практике. Вы можете воспользоваться им бесплатно, но повторное использование этого кода в публикации регулируется Правилами поведения. Вы можете добавить этот скрипт в избранное и использовать его на графике.
Get Access to the exclusive QuantVue indicators: quantvue.io/
Join thousands of traders in our Free Discord: discord.gg/tC7u7magU3
Join thousands of traders in our Free Discord: discord.gg/tC7u7magU3
Отказ от ответственности
Все виды контента, которые вы можете увидеть на TradingView, не являются финансовыми, инвестиционными, торговыми или любыми другими рекомендациями. Мы не предоставляем советы по покупке и продаже активов. Подробнее — в Условиях использования TradingView.