OPEN-SOURCE SCRIPT
Fractal Series History Summary
Обновлено
This script presents a summarized view of a series by drawing lines between series samples taken at power-of-two intervals from the current value.
The intent is to provide a visualization of trendlines at multiple scales, without having to untangle those that my overlap each other.
It doesn't overlay a price-chart as written; it could, but IMHO that would be redundant. It's intended to augment oscillators and other kinds of indicators that don't necessarily scale with a price chart.
The script does not attempt to provide buy or sell triggers, but rather, to provide a visualization tool and a line-drawing tech-demo.
Информация о релизе
- Calculate deltas forwards, not backwards
Remove normalization
Default to absolute values, overlay=true
Информация о релизе
Added a function to display momentum chords to each sampled node, which was my original inspiration for this script.Reverted to tip-first drawing order, which is simpler and actually draws the oldest visible lines.
Информация о релизе
Refactored, added "Average" and "Linear Regression" as basis for fractal history. (The latter greatly improves the accuracy and stability of the historical summary.)Note #1: This indicator repaints by nature.
Note #2: It is not intended to provide buy or sell signals.
Информация о релизе
Fixed some comments, but mainly wanted to update chart to improve visibility of the indicatorИнформация о релизе
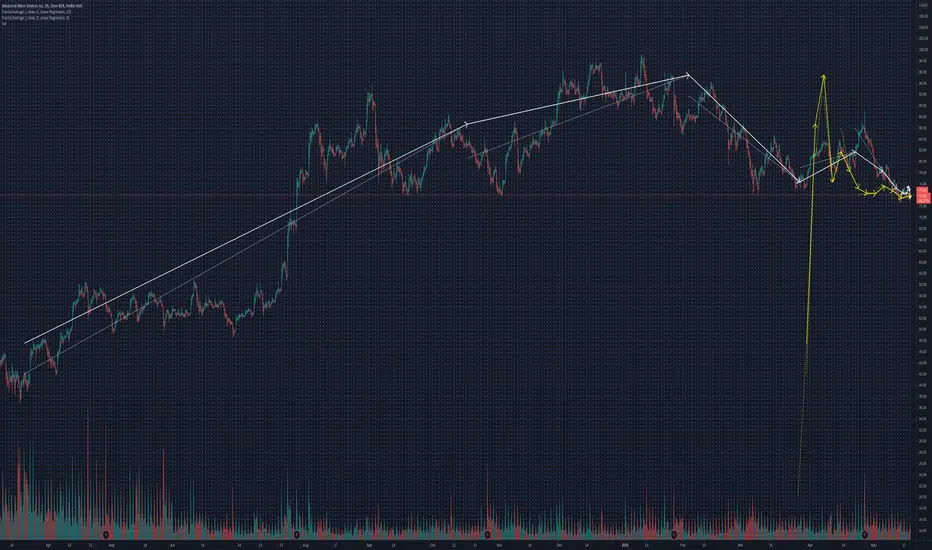
Added an option to display the fractal historical summary in Log Time, which can visually exaggerate recent information and compress information from the more distant past.Adjusting the "Log(time) Factor" parameter will shrink or stretch the summary to your taste (use 0 for linear time.)

(Linear time in white, Log time in yellow)
Скрипт с открытым кодом
В истинном духе TradingView автор этого скрипта опубликовал его с открытым исходным кодом, чтобы трейдеры могли понять, как он работает, и проверить на практике. Вы можете воспользоваться им бесплатно, но повторное использование этого кода в публикации регулируется Правилами поведения. Вы можете добавить этот скрипт в избранное и использовать его на графике.
Отказ от ответственности
Все виды контента, которые вы можете увидеть на TradingView, не являются финансовыми, инвестиционными, торговыми или любыми другими рекомендациями. Мы не предоставляем советы по покупке и продаже активов. Подробнее — в Условиях использования TradingView.