OPEN-SOURCE SCRIPT
Stock Value Rainbow
Stock Valuation based on Book Value, Dividends, Cashflow, Earnings and Estimates and Money Multiplier
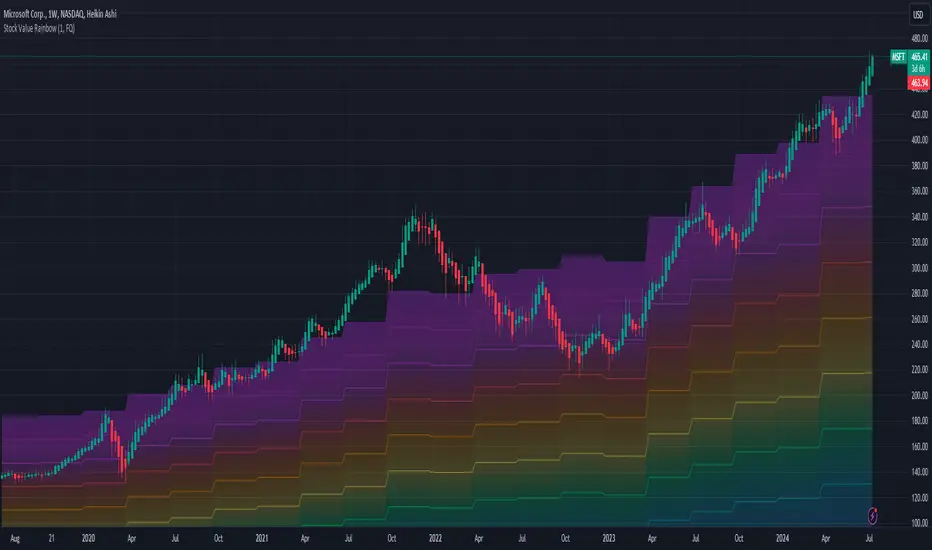
There are many ways to measure stock valuations: some methods are using book value, some are using dividends, some are using cashflow, some are using earnings and some using estimates data. Most of these valuation methods are based on multiplier effect which measure how many times the stock price could expand from their valuation base. This indicator attempts to unify all these measurements using just simple addition of all measurements such as: book value per share, dividend per share, cashflow per share, earning per share, and estimates of earning per share and then using multiplier effect to create beautiful rainbow to see how far the stock has growing up above or below their valuation base. The higher the stock price on rainbow spectrum means it is more expensive and the lower in the rainbow spectrum means it is cheaper. Here is the basic formula explanation:
SV = (BVPS + DPS + CFPS + EPS + EST) * MM
BVPS = Book Value Per Share (Asset - Liability)
DPS = Dividends Per Share
CFPS = Free Cash Flow Per Share
EPS = Earnings Per Share
EST = Estimates of EPS
MM = Money Multiplier (1x, 2x, ... ,10x)
- The gray line represents the stock value SV
- The rainbow above the gray line represents the multiplication factors from 1x, 2x, ..., 10x
- The rainbow below the gray line represents the division factors from 0.8x, 0.6x, ..., 0.2x
Check other script to value stock and index:
- Stock Value Rainbow: script to value stock based on book value, dividend, cash flow, earning and estimates.
- Index Value Rainbow: script to value index based on fed balance sheet and base money supply
- Gold Value Rainbow: script to value gold based on global money supply
- Stock Value US: script to check US stock value
- Stock Value EU: script to check EU stock value
- Stock Value JP: script to check JP stock value
- Stock Value CN: script to check CN stock value
Скрипт с открытым кодом
В истинном духе TradingView автор этого скрипта опубликовал его с открытым исходным кодом, чтобы трейдеры могли понять, как он работает, и проверить на практике. Вы можете воспользоваться им бесплатно, но повторное использование этого кода в публикации регулируется Правилами поведения. Вы можете добавить этот скрипт в избранное и использовать его на графике.
Отказ от ответственности
Все виды контента, которые вы можете увидеть на TradingView, не являются финансовыми, инвестиционными, торговыми или любыми другими рекомендациями. Мы не предоставляем советы по покупке и продаже активов. Подробнее — в Условиях использования TradingView.