OPEN-SOURCE SCRIPT
Historical Volatility Strategy Backtest
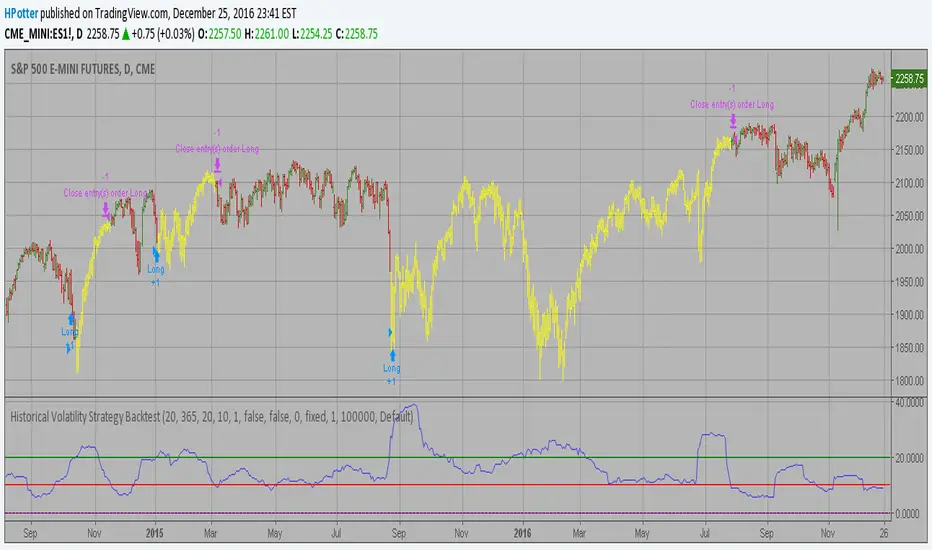
Strategy buy when HVol above BuyBand and close position when HVol below CloseBand.
Markets oscillate from periods of low volatility to high volatility
and back. The author`s research indicates that after periods of
extremely low volatility, volatility tends to increase and price
may move sharply. This increase in volatility tends to correlate
with the beginning of short- to intermediate-term moves in price.
They have found that we can identify which markets are about to make
such a move by measuring the historical volatility and the application
of pattern recognition.
The indicator is calculating as the standard deviation of day-to-day
logarithmic closing price changes expressed as an annualized percentage.
Please, use it only for learning or paper trading. Do not for real trading.
Скрипт с открытым кодом
В истинном духе TradingView автор этого скрипта опубликовал его с открытым исходным кодом, чтобы трейдеры могли понять, как он работает, и проверить на практике. Вы можете воспользоваться им бесплатно, но повторное использование этого кода в публикации регулируется Правилами поведения. Вы можете добавить этот скрипт в избранное и использовать его на графике.
Отказ от ответственности
Все виды контента, которые вы можете увидеть на TradingView, не являются финансовыми, инвестиционными, торговыми или любыми другими рекомендациями. Мы не предоставляем советы по покупке и продаже активов. Подробнее — в Условиях использования TradingView.