PROTECTED SOURCE SCRIPT
Uptrick: Supply and Demand Zones with RSI, MACD and TP signals
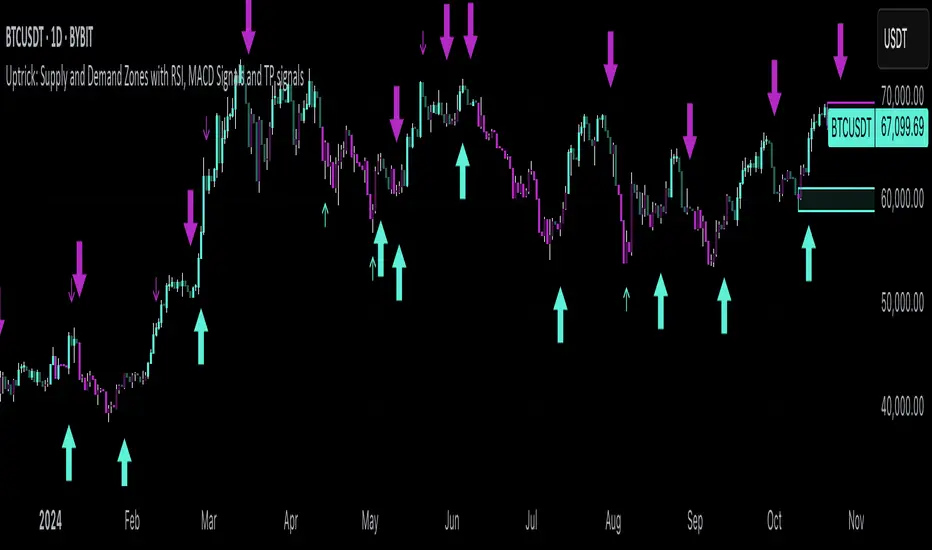
Uptrick: Supply and Demand Zones with RSI, MACD Signals and TP Signals
This script is a comprehensive technical analysis indicator for the TradingView platform, combining multiple strategies and indicators to assist traders in making informed decisions. The script incorporates supply and demand zones, Relative Strength Index (RSI), Moving Average Convergence Divergence (MACD) signals, and trend and take profit signals. Below is a detailed explanation of each feature, its purpose, how to use it, and how it differs from other indicators.
Key Features
Supply and Demand Zones:
Purpose: Identify key price levels where buying (demand) or selling (supply) pressure has historically been strong.
Inputs:
supplySwingLength (Default: 20): Determines the number of bars to consider for identifying swing highs for supply zones.
demandSwingLength (Default: 20): Determines the number of bars to consider for identifying swing lows for demand zones.
zoneExtensionBars (Default: 50): Specifies how many bars to extend the zones to the right for visibility.
Usage: The indicator highlights these zones on the chart, making it easier for traders to spot potential reversal points.
Relative Strength Index (RSI) and Moving Average of RSI:
Purpose: RSI measures the speed and change of price movements, helping to identify overbought or oversold conditions. The moving average of RSI smoothens the RSI values to reduce noise.
Inputs:
lengthrsi (Default: 14): The period for calculating RSI.
lengthrsima (Default: 8): The period for calculating the moving average of RSI.
Usage: Buy and sell signals are generated when the RSI crosses above or below the 50 level, respectively, indicating potential entry or exit points.
MACD (Moving Average Convergence Divergence):
Purpose: MACD is a trend-following momentum indicator that shows the relationship between two moving averages of a security’s price.
Inputs:
macdFastLength (Default: 12): The short period for the fast EMA.
macdSlowLength (Default: 26): The long period for the slow EMA.
macdSignalSmoothing (Default: 9): The period for the signal line.
Usage: Buy and sell signals are generated when the MACD line crosses above or below the signal line, respectively. This is an optional feature that can be enabled or disabled.
Signal Type Selection:
Purpose: Allows the trader to choose between RSI signals or supply/demand zone signals.
Inputs:
signalType (Default: "RSI"): Options are "RSI" or "Supply/Demand".
Usage: The chosen signal type determines the logic for plotting buy and sell signals on the chart.
Take Profit Signals:
Purpose: Provide take profit signals based on statistical volatility.
Inputs:
TheLength (Default: 20): The period for calculating the basis SMA and standard deviation.
tpmult (Default: 2.5): The multiplier for the standard deviation to set the take profit levels.
Usage: Generates buy and sell take profit signals when the price crosses over or under the calculated levels.
Detailed Explanation
Supply and Demand Zones Logic:
Swing High and Swing Low:
Functions isSwingHigh and isSwingLow determine whether the current high or low is the highest or lowest within a specified length, indicating potential supply or demand zones.
Zone Visualization:
When a new swing high or low is detected, a box is drawn from the identified bar and extended to the right for visibility. This helps traders visually identify these critical zones.
The boxes are updated dynamically as new swings are detected, ensuring the most relevant zones are always displayed.
RSI and MACD Signals:
RSI Calculation:
The script calculates the RSI using the specified period and then smooths it using an exponential moving average.
Buy and sell signals are generated based on the RSI's crossover with the 50 level.
MACD Calculation:
The MACD line and signal line are calculated using the specified periods.
Buy and sell signals are generated based on crossovers between the MACD line and the signal line.
These signals can be enabled or disabled based on user preference.
Trend Detection and Take Profit Signals:
Trend Detection:
The script calculates the basis (SMA) and upper and lower bands based on the standard deviation.
It determines the trend strength and direction by comparing the current price to these bands.
Take Profit Levels:
Take profit levels are set by multiplying the standard deviation by a user-defined multiplier.
Signals are plotted when the price crosses these take profit levels, indicating potential exit points.
Differences from Other Indicators
Combination of Multiple Indicators:
This script integrates supply and demand zones with RSI and MACD signals, offering a comprehensive tool for technical analysis.
Most other indicators focus on a single strategy, whereas this script provides a holistic view by combining multiple strategies.
Customizable Inputs:
The script offers a high degree of customization, allowing traders to adjust various parameters to suit their trading style and preferences.
Many indicators have fixed settings, limiting their adaptability to different market conditions.
Dynamic Zone Visualization:
The supply and demand zones are dynamically updated, providing real-time insights into key price levels.
This feature is not commonly found in other indicators, which may rely on static levels or less visually intuitive methods.
Usage Guide
Setup:
Add the script to your TradingView chart.
Adjust the input parameters as needed to match your trading strategy.
Interpreting Signals:
Supply and Demand Zones: Look for potential reversal points at these zones.
RSI and MACD Signals: Use these signals to identify potential entry and exit points.
Take Profit Signals: Set take profit levels based on the calculated signals to manage risk and lock in profits.
Combining Signals:
Combine signals from different features to increase the reliability of your trading decisions.
For example, a buy signal from RSI combined with a price approaching a demand zone may indicate a stronger buy opportunity.
Inputs Explained
Supply and Demand Zones:
supplySwingLength: The length of bars to consider for identifying swing highs.
demandSwingLength: The length of bars to consider for identifying swing lows.
zoneExtensionBars: The number of bars to extend the zones to the right.
RSI:
lengthrsi: The period for calculating the RSI.
lengthrsima: The period for calculating the EMA of the RSI.
MACD:
macdFastLength: The short period for the fast EMA.
macdSlowLength: The long period for the slow EMA.
macdSignalSmoothing: The period for the signal line.
Signal Type:
signalType: Choose between "RSI" and "Supply/Demand" signals.
Take Profit:
TheLength: The period for calculating the basis SMA and standard deviation.
tpmult: The multiplier for the standard deviation to set the take profit levels.
Conclusion
The "Uptrick: Supply and Demand Zones with RSI, MACD Signals and TP signals" script is a powerful and versatile indicator that combines multiple strategies to provide traders with a comprehensive analysis tool. Its detailed visualization of supply and demand zones, coupled with RSI and MACD signals, and trend-based take profit signals, makes it an invaluable tool for both novice and experienced traders. By understanding and utilizing its features effectively, traders can make more informed and confident trading decisions.
✨ Exclusive indicators and "protected indicators" codes on Discord for free!
📲 Discord: discord.gg/Def47ueyuD
📲 Discord: discord.gg/Def47ueyuD
Отказ от ответственности
Все виды контента, которые вы можете увидеть на TradingView, не являются финансовыми, инвестиционными, торговыми или любыми другими рекомендациями. Мы не предоставляем советы по покупке и продаже активов. Подробнее — в Условиях использования TradingView.