Wyckoff Trading Range
⭐️ Wyckoff Price Cycle
According to Wyckoff, the market can be understood and anticipated through detailed analysis of supply and demand, which can be ascertained from studying price action, volume and time. As a broker, he was in a position to observe the activities of highly successful individuals and groups who dominated specific issues; consequently, he was able to decipher, via the use of what he called vertical (bar) and figure (Point and Figure) charts, the future intentions of those large interests. An idealized schematic of how he conceptualized the large interests' preparation for and execution of bull and bear markets is depicted in the figure below. The time to enter long orders is towards the end of the preparation for a price markup or bull market (accumulation of large lines of stock), while the time to initiate short positions is at the end of the preparation for price markdown.
⭐️ FEATURES
- Supply and Demand Zones: <deleted>
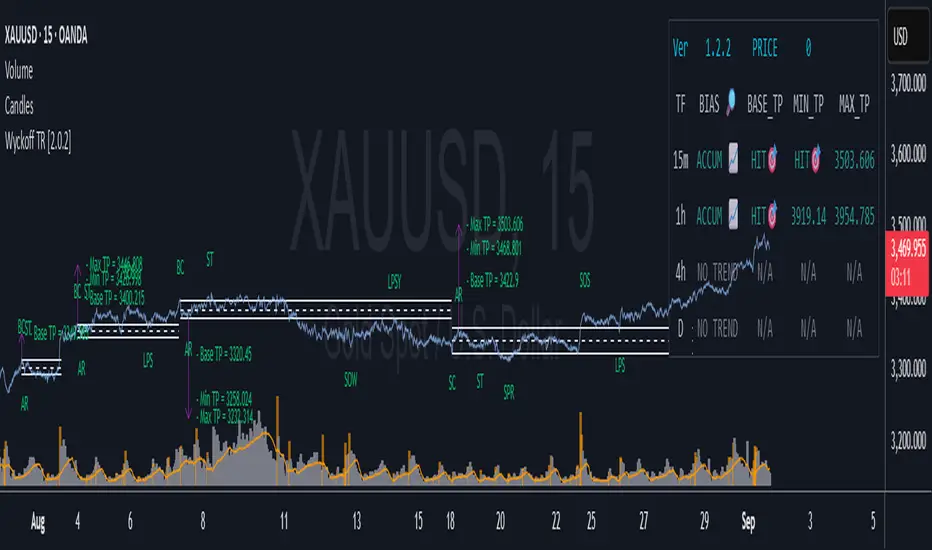
- Wyckoff Schematics and Events.
- Point and Figure (PNF) Target.
* View with PNF chart
⭐️ USAGES
When it comes to trading using the Wyckoff method, there are five key points to consider for entering trades, as illustrated below
Point #1: Trade in the direction of the previous trend (Phase B)
Point #2: Trade against the previous trend. (Phase B)
Point #3: Identify the point of strength that forms a new trend. (Phase C)
Point #4: Confirm the new trend. (Phase D)
Point #5: Ensure that prices move in the correct direction and do not revert within the Trading Range (dont break LPS/LPSY). (Phase E)
⭐️NOTES:
- Use the 1 minute or 5 minute timeframe to view the bias dashboard. Using a timeframe longer than 5 minute may provide an inaccurate bias view.
- The alert new TR function will give you alert 6 timeframe on dashboard with only one setup. The best timeframe to set up an alert is 2 hours.
- Merge 4 offsets into 1 and rename it to “Radius.”
- Tweak some settings to get better TR and TP PNF
- Update the HTF Top/Bot Trading Range inspired by PDH/PDL.
- Update EQH/EQL
- Optimize code.
Скрипт с ограниченным доступом
Доступ к этому скрипту разрешён только для пользователей, авторизованных автором, и для этого обычно требуется оплата. Вы можете добавить скрипт в список избранных, но использовать его можно будет только после запроса на доступ и получения разрешения от автора. Свяжитесь с wckni1873, чтобы узнать больше, или следуйте инструкциям автора ниже.
Обратите внимание, что это приватный скрипт с ограниченным доступом, который модераторы скриптов не проверяли, поэтому ещё не установлено, насколько он соответствует Правилам поведения. TradingView не советует платить за скрипт и использовать его, если вы на 100% не доверяете его автору и не понимаете, как он работает. Часто вы можете найти хорошую альтернативу с открытым исходным кодом бесплатно в нашем разделе Скрипты сообщества.