PROTECTED SOURCE SCRIPT
Yearly+Monthly Pivots
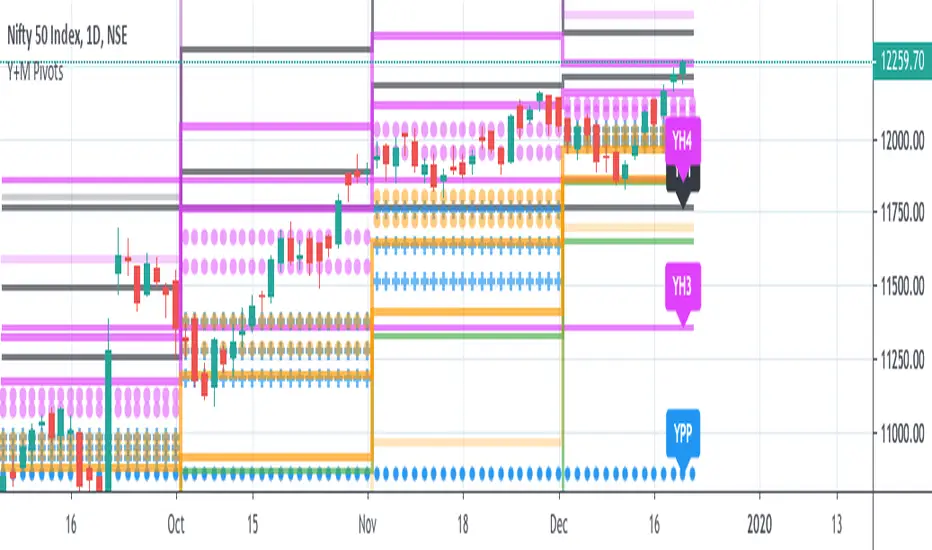
The following script helps you instantly plot yearly and monthly plots for indices, equities, commodities etc.
This can help you know the major monthly and yearly resistances and support.
The pivots described in the book are discussed in " Secrets of a Pivot Boss" by Franklin O. Ochoa.
----------------------------------------------------------------------------------------------------------------------------------------
Yearly Pivots :
Floor pivots -
The yearly pivots are labelled for quick reference.
YR1 - Yearly Resistance 1 - Black line
YR2 - Yearly Resistance 2 - Black line
YPP - Yearly CPR - Blue circles
YS1 - Yearly Support 1 - Green line
Note : S2 and S3 are not plotted as they are rarely touched over the course of a year.
Camarilla pivots -
YH3,YH4 - Fuchsia line
YL3,YL4 - Orange line
----------------------------------------------------------------------------------------------------------------------------------------
Monthly Pivots :
The monthly pivots have same color code as yearly pivots.
Floor pivots -
The following are plotted :-
R1,R2,R3,R4,S1,S2 - step_line
CPR - cross
Camarilla pivots -
H1,H2,L1,L2 - dotted
H3,H4,H5,L3,L4,L5 - step_line
Note : H5 and L5 are faded to avoid confusion with other resistances and support.
----------------------------------------------------------------------------------------------------------------------------------------
Constructive feedback appreciated.
Disclaimer : The indicators, strategies, columns, articles and all other features discussed here are for educational purposes only and should not be construed as investment and/or trading advice/tips.
Отказ от ответственности
Все виды контента, которые вы можете увидеть на TradingView, не являются финансовыми, инвестиционными, торговыми или любыми другими рекомендациями. Мы не предоставляем советы по покупке и продаже активов. Подробнее — в Условиях использования TradingView.