OPEN-SOURCE SCRIPT
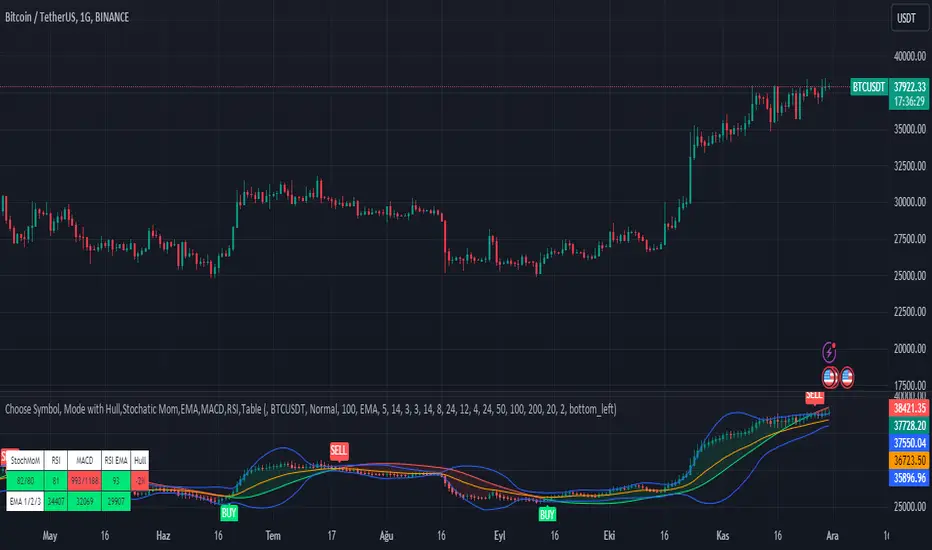
Choose Symbol, Mode with Hull,Stochatic Mom,EMA,MACD,RSI,Table
This Pine Script code is a comprehensive indicator for the TradingView platform, offering a variety of technical analysis tools. Below is an English introduction to its features and purposes:
Introduction:
This indicator is designed for traders on TradingView and provides a multi-functional analysis toolset. It includes different charting modes (Heikin-Ashi, Linear, and Normal), a Hull Moving Average (Hull), Stochastic Momentum, RSI (Relative Strength Index), MACD (Moving Average Convergence Divergence), EMA (Exponential Moving Average), Bollinger Bands, and a summary table displaying key metrics.
Key Features:
Charting Modes:
Users can choose between "Heikin-Ashi," "Linear," or "Normal" modes to visualize price data in different ways.
Hull Moving Average:
The script incorporates the Hull Moving Average for trend analysis, highlighting potential buy and sell signals.
Stochastic Momentum:
Stochastic Momentum, with customizable parameters (K, D, and Smooth), is included to identify overbought and oversold conditions.
RSI (Relative Strength Index):
RSI is calculated and displayed, aiding in identifying potential trend reversals or exhaustion points.
MACD (Moving Average Convergence Divergence):
The MACD indicator is included, along with a histogram, to highlight changes in momentum and potential crossovers.
RSI Momentum:
RSI Momentum is calculated, providing additional insights into momentum changes.
Exponential Moving Averages (EMA):
The script calculates and displays three EMAs (Exponential Moving Averages) with customizable periods.
Bollinger Bands:
Bollinger Bands are incorporated, offering insights into volatility and potential price reversals.
Summary Table:
A table is displayed on the chart summarizing key metrics, including Stochastic MoM, RSI, MACD, RSI EMA, Hull percentage change, and EMA values.
Customization:
Users have the option to customize various parameters, including chart modes, lengths of moving averages, Stochastic parameters, and more.
Usage:
The indicator aims to provide a comprehensive view of price action and potential trend changes. Traders can use it for technical analysis and decision-making.
Important Note:
This script is provided for educational purposes and does not constitute financial advice. Traders and investors should conduct their research and analysis before making any trading decisions.
[Note: This code is for educational purposes and does not constitute investment advice.]
Скрипт с открытым кодом
В истинном духе TradingView автор этого скрипта опубликовал его с открытым исходным кодом, чтобы трейдеры могли понять, как он работает, и проверить на практике. Вы можете воспользоваться им бесплатно, но повторное использование этого кода в публикации регулируется Правилами поведения. Вы можете добавить этот скрипт в избранное и использовать его на графике.
Отказ от ответственности
Все виды контента, которые вы можете увидеть на TradingView, не являются финансовыми, инвестиционными, торговыми или любыми другими рекомендациями. Мы не предоставляем советы по покупке и продаже активов. Подробнее — в Условиях использования TradingView.