OPEN-SOURCE SCRIPT
HMA Comparison Plot
https://www.tradingview.com/chart/OsBXckpZ/
I use this on any time frame and it should work fine on the price action of any instrument. Since there is more information in longer time frames I give them more weight.
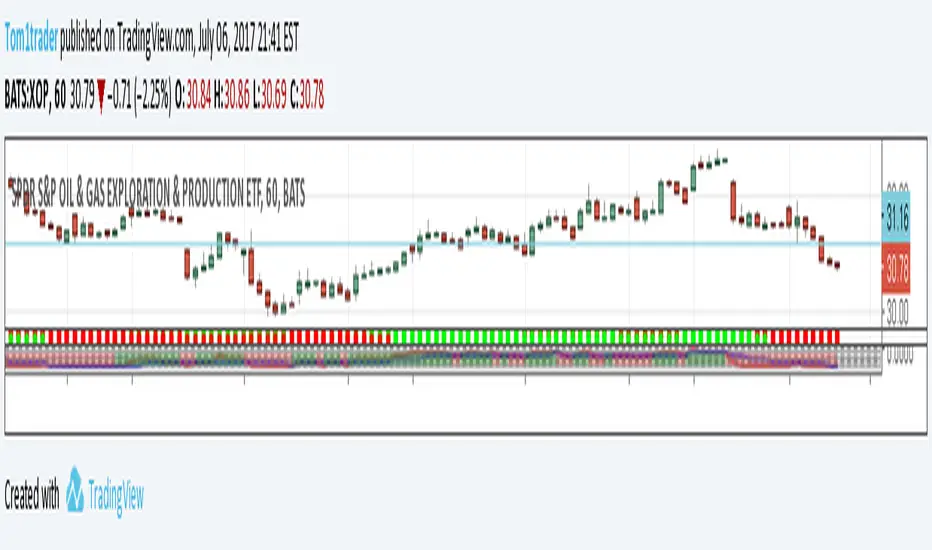
The four rows of circles / dots (1 column of 4 for each bar) show the relationship between 5 Hull moving averages. The top dot compares the variable "len" wihout quotes ("Length" input, the fastest moving average) with len1 (the next moving average - the next four beginning with this are longer than the previous by the "Sequential Spacing . ." input) if the fastest is above the next the top dot is green else it is red. The next 3 dots compare the rest of the 5.
It works well to confirm other indicators and using Hull moving averages minimizes lag.
Like all indicators it tells very well the past so while using them to firm expectations I place my trades knowing the odds are very near 50/50 on the direction of the next bar.
Have fun and good luck with this and Keep smiling! Tom1trader
I use this on any time frame and it should work fine on the price action of any instrument. Since there is more information in longer time frames I give them more weight.
The four rows of circles / dots (1 column of 4 for each bar) show the relationship between 5 Hull moving averages. The top dot compares the variable "len" wihout quotes ("Length" input, the fastest moving average) with len1 (the next moving average - the next four beginning with this are longer than the previous by the "Sequential Spacing . ." input) if the fastest is above the next the top dot is green else it is red. The next 3 dots compare the rest of the 5.
It works well to confirm other indicators and using Hull moving averages minimizes lag.
Like all indicators it tells very well the past so while using them to firm expectations I place my trades knowing the odds are very near 50/50 on the direction of the next bar.
Have fun and good luck with this and Keep smiling! Tom1trader
Скрипт с открытым кодом
В истинном духе TradingView автор этого скрипта опубликовал его с открытым исходным кодом, чтобы трейдеры могли понять, как он работает, и проверить на практике. Вы можете воспользоваться им бесплатно, но повторное использование этого кода в публикации регулируется Правилами поведения. Вы можете добавить этот скрипт в избранное и использовать его на графике.
Отказ от ответственности
Все виды контента, которые вы можете увидеть на TradingView, не являются финансовыми, инвестиционными, торговыми или любыми другими рекомендациями. Мы не предоставляем советы по покупке и продаже активов. Подробнее — в Условиях использования TradingView.