OPEN-SOURCE SCRIPT
Price Bubble Meter (Moving Average to Price Distance)
Обновлено
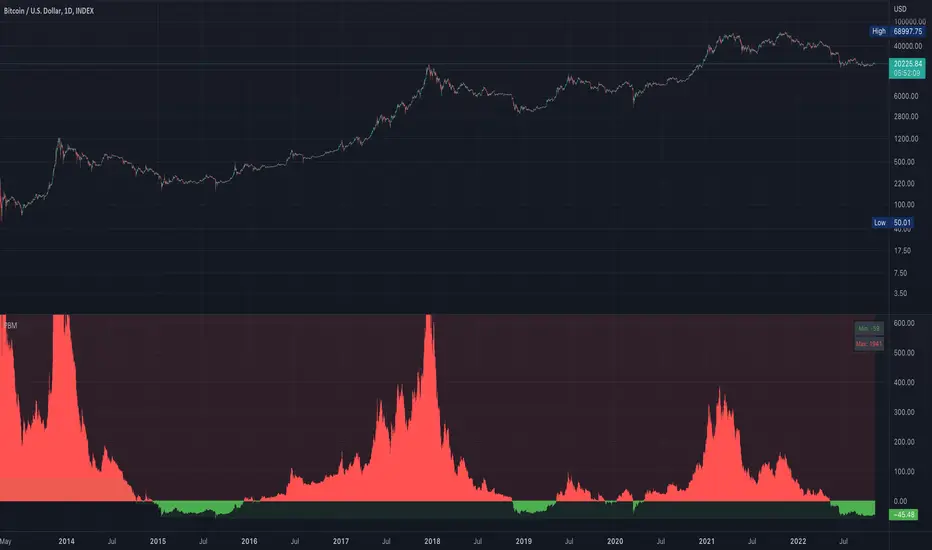
This indicator measures Price Distance (in %) from any given Moving Average.
It will help you see if the price is over extended or in the fair price zone.
Trend Analysis
DCA Opportunity Finder
Yes you can manually measure it all using a ruler, but aint no one got time for that foo.
It will help you see if the price is over extended or in the fair price zone.
Trend Analysis
- How much % higher is the current price compared to 200W SMA
- What % has been the maximum price rise from 200W SMA
- What % has been the lowest price fall from 200W SMA
DCA Opportunity Finder
- How much % higher is the current price compared to 2 year SMA
- What % has been the maximum price rise from 2 year SMA
- What % has been the lowest price fall from 2 year SMA
Yes you can manually measure it all using a ruler, but aint no one got time for that foo.
Информация о релизе
Switching to 2 year on weekly timeframeИнформация о релизе
Change the logic to capture Lows and HighsИнформация о релизе
added display for historic min and max bubble levelsСкрипт с открытым кодом
В истинном духе TradingView автор этого скрипта опубликовал его с открытым исходным кодом, чтобы трейдеры могли понять, как он работает, и проверить на практике. Вы можете воспользоваться им бесплатно, но повторное использование этого кода в публикации регулируется Правилами поведения. Вы можете добавить этот скрипт в избранное и использовать его на графике.
Отказ от ответственности
Все виды контента, которые вы можете увидеть на TradingView, не являются финансовыми, инвестиционными, торговыми или любыми другими рекомендациями. Мы не предоставляем советы по покупке и продаже активов. Подробнее — в Условиях использования TradingView.