PROTECTED SOURCE SCRIPT
Groot Index Black Version
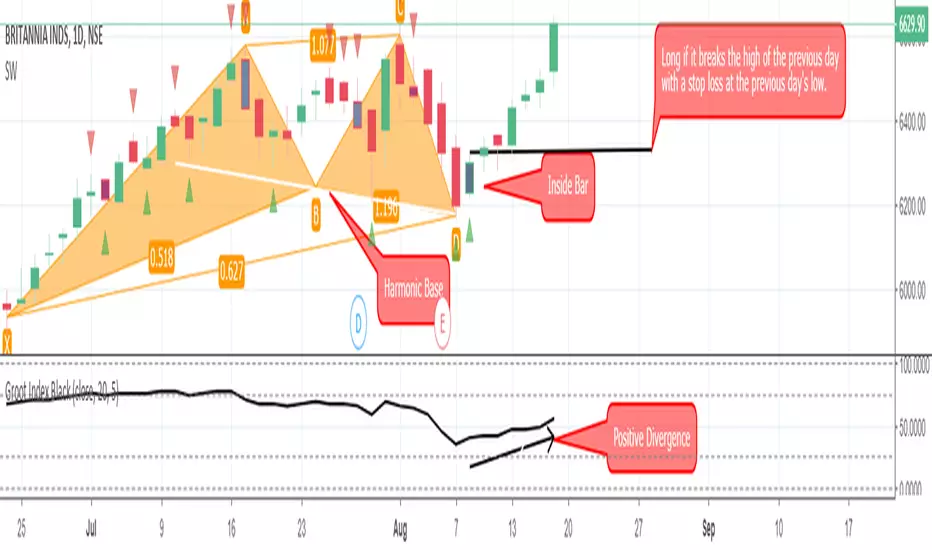
For validation of Harmonic Pattern. We have a weird way of clubbing few things into Moving Average to spot out pivot levels. This will work better than normal RSI in Indian Markets due to its manipulative nature. It also shows up speculative volume buildups.
You can select three things here. The best will be if you leave it at default settings.
25 indicates overbought.
75 indicates oversold.
But, as it has the impact from the volume of the stock apart from prices, it can not be named as a lagging nor a leading indicator.
Use it for divergence testing and as an additional method for confirming Potential Reverse Zones (PRZs)
If you want to use this in a black chart, use this indicator which shows the lines in white -
Get trades instantly and discuss them with me at my Slack Channel @ unofficed.com/chat/
Our community is full with traders who actually trade!
Telegram: t.me/unofficed
Our community is full with traders who actually trade!
Telegram: t.me/unofficed
Отказ от ответственности
Все виды контента, которые вы можете увидеть на TradingView, не являются финансовыми, инвестиционными, торговыми или любыми другими рекомендациями. Мы не предоставляем советы по покупке и продаже активов. Подробнее — в Условиях использования TradingView.