OPEN-SOURCE SCRIPT
Bollinger Bands Cross Strategy
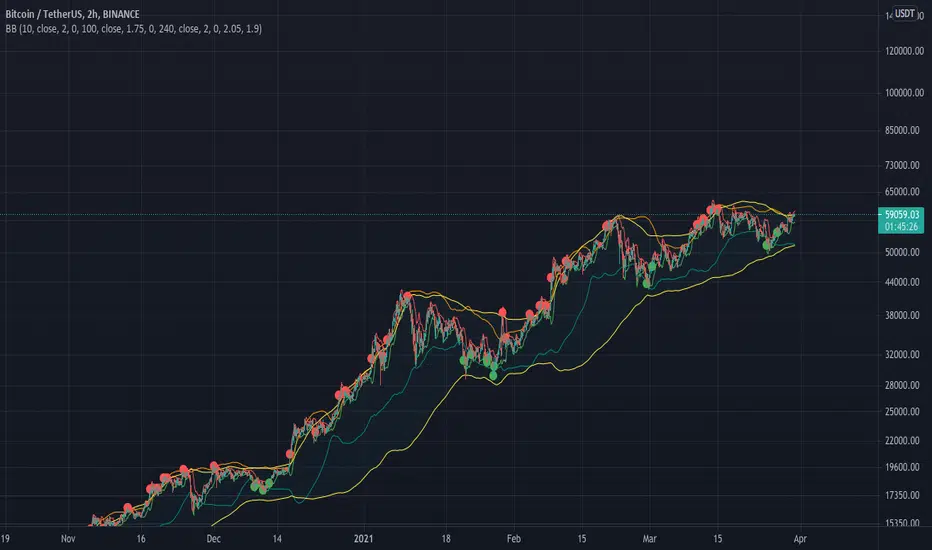
This strategy finds key buying and selling points during highly volatile market conditions. It works best on 2 hour timeframes. use the "same as chart time frame".
Red circles are selling points, and green circles are buying points.
During a bull market, it will find the best buying times, when price capitulates.
During a bear market it will find the best selling times when prices spikes higher.
It will be wrong when the market conditions change from one to the other.
During a strong uptrend without large volatility, it will generate more sell signals than wanted, you can adjust the sell-basis to account for this, and vice versa for the buy basis.
Скрипт с открытым кодом
В истинном духе TradingView автор этого скрипта опубликовал его с открытым исходным кодом, чтобы трейдеры могли понять, как он работает, и проверить на практике. Вы можете воспользоваться им бесплатно, но повторное использование этого кода в публикации регулируется Правилами поведения. Вы можете добавить этот скрипт в избранное и использовать его на графике.
Отказ от ответственности
Все виды контента, которые вы можете увидеть на TradingView, не являются финансовыми, инвестиционными, торговыми или любыми другими рекомендациями. Мы не предоставляем советы по покупке и продаже активов. Подробнее — в Условиях использования TradingView.