Multi-Timeframe ATR Levels
This indicator plots the upside and downside ATR levels popularized by Trader Dante.
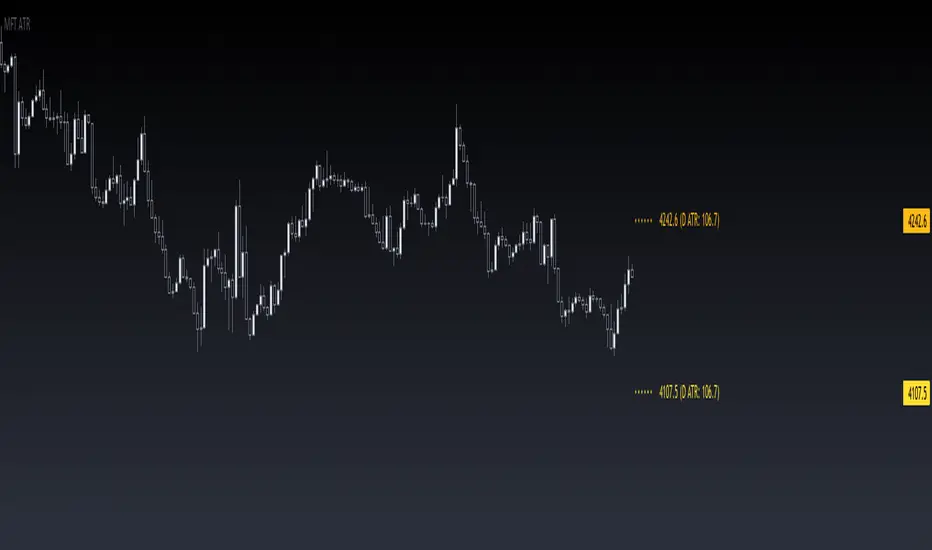
█ CONCEPTS
Beyond a level's boundary, a market is trading over its average volatility. The indicator adds confirmation to "reversal" setups located at likely mean reversion. Oppositely, it highlights trades with an increased risk where the price is over-extended and when the market is possibly exhausted.
Inside the levels’ boundaries, a market is trading within its average range. The indicator adds confluence to your target selection. Indeed, a target set at or nearby a level is at reasonable reach for the selected period. In addition, it can improve your stop placement. Tucking your stop-loss outside the boundary of a level adds an extra assurance that your stop is beyond reach.
█ FEATURES
Multi-Timeframe
By default, the indicator sets the timeframe to the daily for tracking how much price moves compared to its average volatility during a day. To the same extent, you can set it to any other timeframe. For example, you can use the weekly or the monthly timeframe for adjusting your trading during the week or when approaching the end of the month.
Configurable ATR
• Pick your preferred smoothing between the Simple Moving Average (SMA) or the Relative Moving Average (RMA). The SMA is used in the original MT4 indicator, and the RMA is the default in TradingView.
• Set the length for getting the average price movement. For example, you can set it to 20 for the daily ATR (20 trading days in a month), 12 for the weekly ATR (3 months), or 6 for the monthly ATR. Also, you may set a shorter length when you want to emphasize the recent price volatility.
• Apply a custom multiplier on the ATR when you want to focus on a particular price movement.
• Select the reference between “previous” or “current” ATR value (default set on previous).
Customizable Labels
• Personalize what info to show in the labels located on the right side of the levels. You can compose the data for showing the price, the ATR, both the price and the ATR or none.
• On hovering a label, a smart tooltip displays the complementary data. The less info a label displays, the more its tooltip shows.
• Choose how to display the values. In addition to the labels, the indicator can display the last values on the price scale, the status line, and the data window.
Enhanced Coloring
At a glance, see which level the price is approaching with the "Cold & Warm" coloring or quickly glimpse when the price has reached or exceeded the ATR with the "Overflow" coloring.
Others
• Automatically hides levels when the chart’s timeframe is higher than the indicator’s one.
• Alerts setting.
█ NOTES
Calculation
- Upper band = low* + ATR
- Lower band = high* - ATR
*The previous close is used when a gap up/down occurs.
This is a PREMIUM indicator. I also have a free version of the Daily ATR Levels.
Features
- Show the levels traces
https://www.tradingview.com/x/L1YNiv4j/When enabled, the indicator shows the levels' recent evolution and is configured to leave future prints. - Show the next ATR levels
https://www.tradingview.com/x/NHc5WUBq/When enabled, this indicator displays the upcoming ATR levels if the market is closed. It is handy if you like to prepare and plan ahead.
Improvements
- Display notifications on the bottom right of the chart
- Upgrade labels to show the multiplier selection
- Show multiplied ATR value in labels (and tooltips), status line, and data window
- Show status line values on historical bars
- Cover extended trading hours when activated
Bug fixes
- Align the rounding of numbers as the chart (from min tick to min precision)
- Change to overflow color when price tags a level
- Show the previous ATR levels
When enabled, the indicator displays the historical end-of-period levels.
- Add options to configure the line style and width
- Add alerts programmed to fire when reaching the first ATR level on each period
- Minor improvements
⭐️ Listed as "Trusted Pine Programmer"
🔒 Premium indicators: sbtnc.gumroad.com
☕️ Support me: buymeacoffee.com/sbtnc
Скрипт с ограниченным доступом
Доступ к этому скрипту разрешён только для пользователей, авторизованных автором, и для этого обычно требуется оплата. Вы можете добавить скрипт в список избранных, но использовать его можно будет только после запроса на доступ и получения разрешения от автора. Свяжитесь с sbtnc, чтобы узнать больше, или следуйте инструкциям автора ниже.
Обратите внимание, что это приватный скрипт с ограниченным доступом, который модераторы скриптов не проверяли, поэтому ещё не установлено, насколько он соответствует Правилам поведения. TradingView не советует платить за скрипт и использовать его, если вы на 100% не доверяете его автору и не понимаете, как он работает. Часто вы можете найти хорошую альтернативу с открытым исходным кодом бесплатно в нашем разделе Скрипты сообщества.