PROTECTED SOURCE SCRIPT
Custom seconds interval candle
This script requires 1S timeframe chart (Premium subscription)
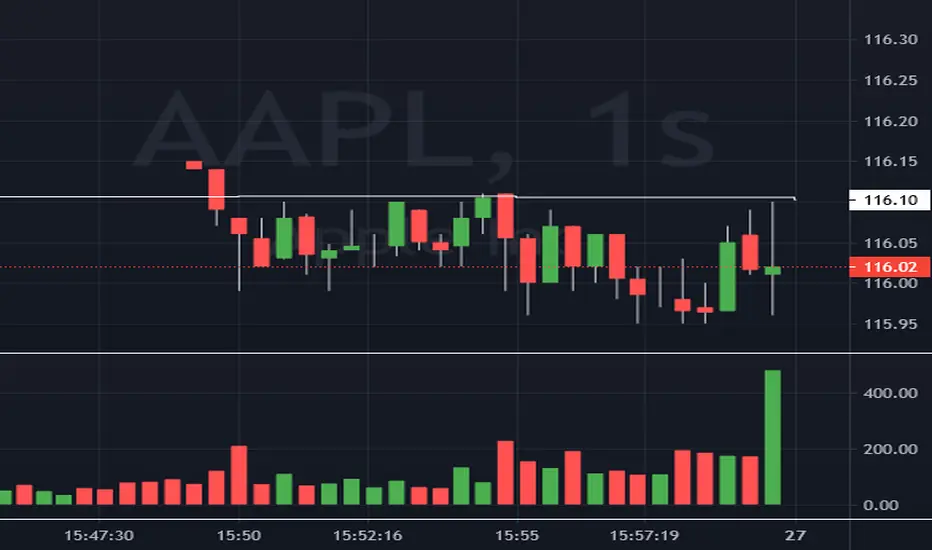
This script let you chart candlestick plot for any second timeframe, as an indicator.
In the example it is shown 24S chart.
Due to tradingview maximum number of drawings, the number of candlesticks shown is limited. You can use replay function to review historical data, with the limitation of using 1S timeframe.
Colors of candlestick bodies and wicks are customizable, as well as the width.
You can review the indicator in the following layout, that will be always available to copy: tradingview.com/chart/kVwpmAyW/
Отказ от ответственности
Все виды контента, которые вы можете увидеть на TradingView, не являются финансовыми, инвестиционными, торговыми или любыми другими рекомендациями. Мы не предоставляем советы по покупке и продаже активов. Подробнее — в Условиях использования TradingView.