PROTECTED SOURCE SCRIPT
Dynamic Momentum Index
This indicator was originally developed by Tushar S. Chande and Stanley Kroll. They described it in their book The New Technical Trader(1994).
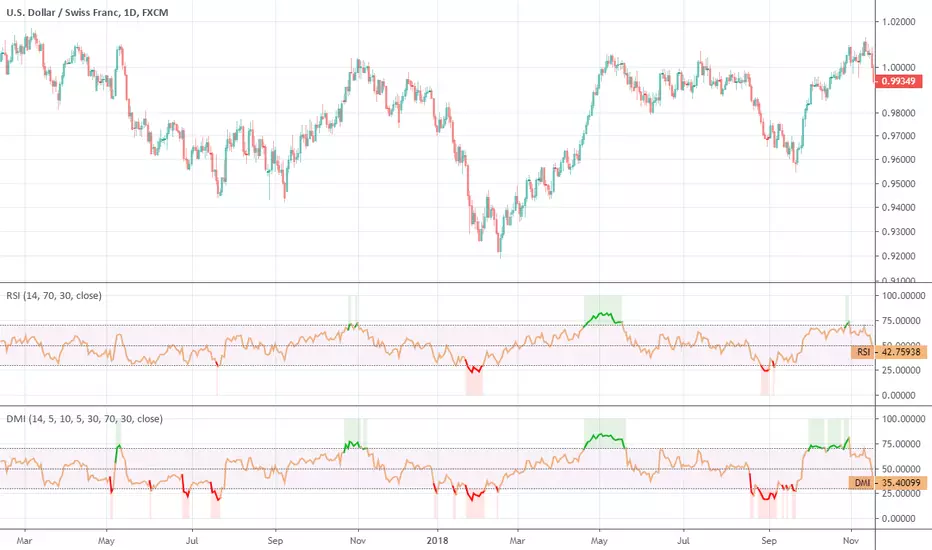
The period for DMI calculation depends on the market volatility. DMI uses a longer period as volatility decreases and a shorter period as volatility increases, making it more responsive to changing prices than RSI which uses a fixed period. That's why the indicator is called "dynamic". You can specify the DMI period bounds (defaults are 5 and 30) in the indicator settings.
The calculation is based on the standard deviation of prices. The authors used a custom volatility index to adjust RSI period - the similar concept was used in the original VIDYA (yes, it was based on the standard deviation).
Source code on request
Freelance -> Telegram: @alex_everget
A list of FREE indicators:
bit.ly/2S7EPuN
A list of PAID indicators:
bit.ly/33MA81f
Earn $15:
tradingview.com/pricing/?share_your_love=everget
A list of FREE indicators:
bit.ly/2S7EPuN
A list of PAID indicators:
bit.ly/33MA81f
Earn $15:
tradingview.com/pricing/?share_your_love=everget
Отказ от ответственности
Все виды контента, которые вы можете увидеть на TradingView, не являются финансовыми, инвестиционными, торговыми или любыми другими рекомендациями. Мы не предоставляем советы по покупке и продаже активов. Подробнее — в Условиях использования TradingView.