PROTECTED SOURCE SCRIPT
[_ParkF]cRSI
Обновлено
Hi, it's been a while since I posted a script.
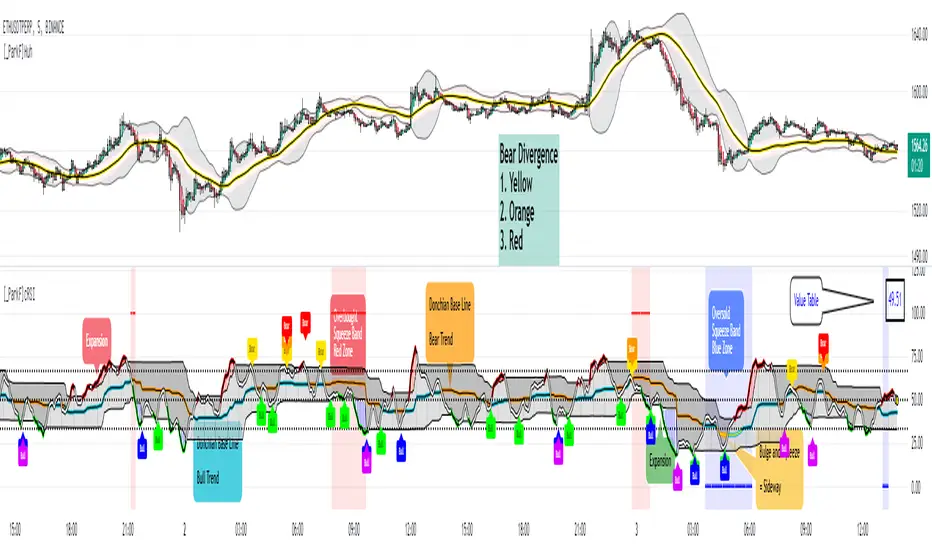
This script basically puts the principle of convergence and divergence first.
(The Bollinger Band on the main chart is for reference)
The cRSI will move within the range of 0-100 just like the normal RSI
Along with that, there is a Donchian channel that will be the main activity area of the cRSI
If you know the characteristics of the Bollinger Band, it might be easy to understand
Basically, it will have the Expansion - Bulge - Squeeze Cycle
I wanted to express the movement of the wave visually.
Donchian Channel can be viewed to check Expansion - Bulge - Squeeze.
The centerline of the Donchian Channel is important because it plays a key role in identifying trends, such as 50 of the cRSI.
Also, Bear and Bull Divergence has 3 different colors
The reason is that the Divergence measurement period values are different.
Bear Divergence will be marked with Yellow, Orange, Red Label, and Bull Divergence will be marked with Green, Blue and Purple Label Purple. There will be a longer period of diversity in the order listed order.
I hope it helps your trading.
--------------------------------------------------------------------------------------------------------------------------------------------------------------------------------------------------------------------------------------------------------------------
안녕하세요, 오랜만에 새로운 지표를 올립니다.
이 지표는 기본적으로 수렴과 발산을 가장 중요하게 생각한 것입니다.
(메인 차트에 있는 볼린저 밴드는 참고를 위한 것입니다.)
cRSI는 일반적 RSI와 마찬가지로 0-100의 범위 안에서 움직이겠지만
그와 함께 cRSI의 주 활도 범위가 될 돈치안 채널이 함께 존재해서
볼린저 밴드의 특성을 알고 있다면 이해하기 쉬울 수 있을 것 같은데
기본적으로 Expansion - Bulge - Squeeze의 사이클을 가질 것이고
그 파동에 따른 RSI의 움직을 시각적으로 표현해보고 싶어서 만들었습니다.
돈치안 채널은 Expansion - Bulge - Squeeze 를 확인하기 위해 존재한다고 보면 될 것이고
돈치안 채널의 중심선은 cRSI의 50의 위치와 같이 추세를 확인하는데 있어
중점적인 역할을 하기 때문에 유의깊게 보면 좋습니다.
또, 하락과 상승 다이버전스는 각각 3가지 종류이고 색이 다릅니다.
이뉴는 각각의 다이버전스의 측정 기간값을 다르게 했기 때문이며,
하락 다이버전스는 노랑, 주황, 빨강 라벨로 표시 될 것이고
상승 다이버전스는 초록, 파랑, 보라 라벨로 표시 되며,
나열한 순서대로 더 긴 기간값의 다이버전스가 라벨로 플롯됩니다.
트레이딩에 도움이 됐으면 좋겠습니다.
Информация о релизе
change colorИнформация о релизе
closedОтказ от ответственности
Все виды контента, которые вы можете увидеть на TradingView, не являются финансовыми, инвестиционными, торговыми или любыми другими рекомендациями. Мы не предоставляем советы по покупке и продаже активов. Подробнее — в Условиях использования TradingView.