PROTECTED SOURCE SCRIPT
[RG9]High Low Ribbons
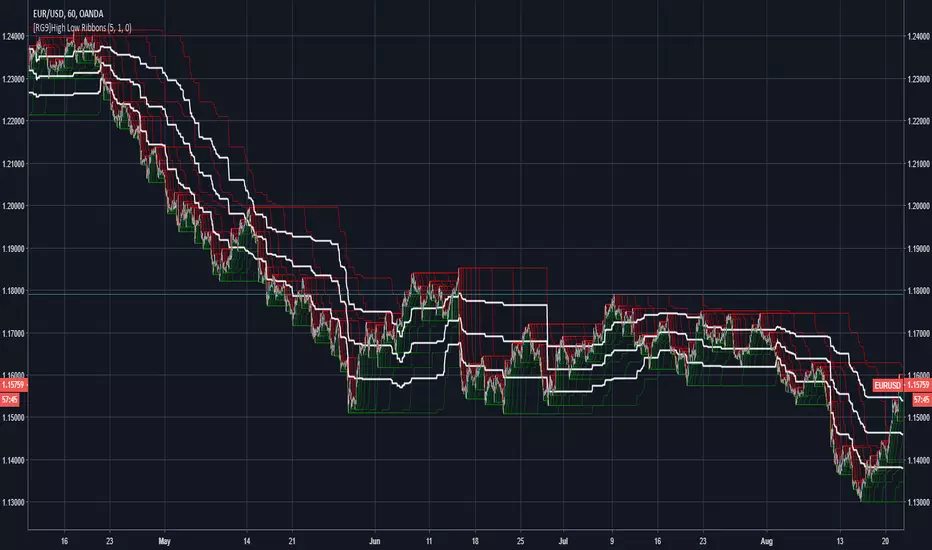
This indicator shows the 9 different period highs and lows dynamically spaced based off of fibonacci numbers. The parameter fib_start gives the script the starting iteration for the first ribbon period. EX. fib_start of 5 = period of 5. It then also shows 8 more Fibonacci numbers up for high low periods. Ex. 5 8 13 21 34 55 89 144 233 period highs and lows. The white lines are space 1/4, 2/4, and 3/4 of the distance between the longest period low and high.
Отказ от ответственности
Все виды контента, которые вы можете увидеть на TradingView, не являются финансовыми, инвестиционными, торговыми или любыми другими рекомендациями. Мы не предоставляем советы по покупке и продаже активов. Подробнее — в Условиях использования TradingView.