OPEN-SOURCE SCRIPT
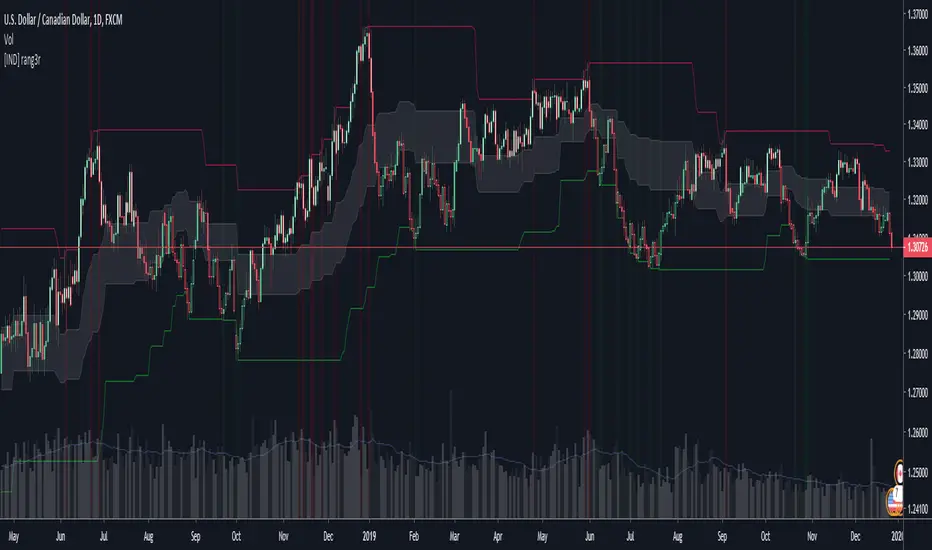
rang3r: A support/resistance indicator with an included cloud.

This indicator finds the minimum and maximum values within a set time period.
Crosses of these minimum and maximum values are noted with the green/red background colours.
The indicator also produces a "cloud", which is generated through the 0.382 and 0.612 points between the two maximum and minimum lines.
Settings:
Entry Period: Time period the indicator checks for min/max points.
Exit Period: Currently Redundant, but may be updated.
Sensitivity: Needed as a leeway for how close a value needs to be to a min/max for it to be considered a cross. I recommend keeping this at default.
Скрипт с открытым кодом
В истинном духе TradingView автор этого скрипта опубликовал его с открытым исходным кодом, чтобы трейдеры могли понять, как он работает, и проверить на практике. Вы можете воспользоваться им бесплатно, но повторное использование этого кода в публикации регулируется Правилами поведения. Вы можете добавить этот скрипт в избранное и использовать его на графике.
Отказ от ответственности
Все виды контента, которые вы можете увидеть на TradingView, не являются финансовыми, инвестиционными, торговыми или любыми другими рекомендациями. Мы не предоставляем советы по покупке и продаже активов. Подробнее — в Условиях использования TradingView.