INVITE-ONLY SCRIPT
Buy and Sell Pressure
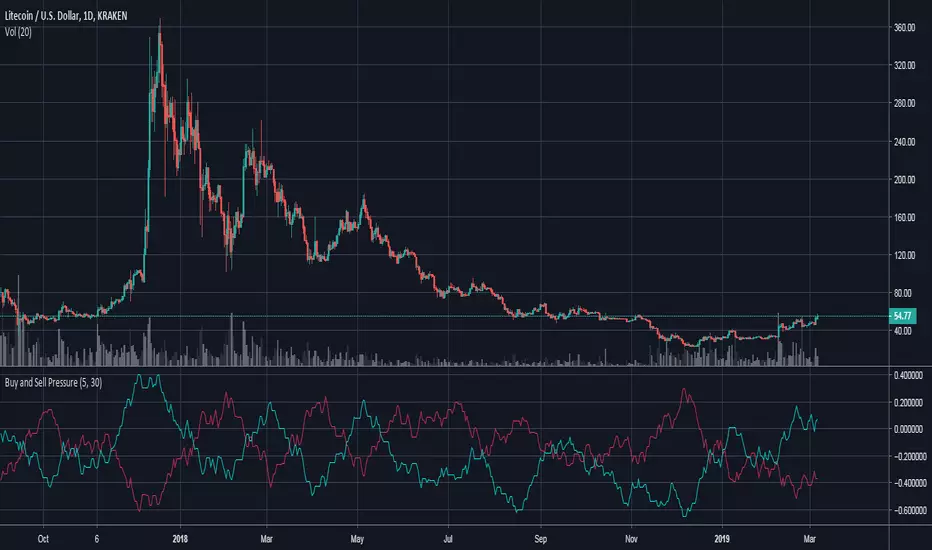
This indicator is an interpolation of the demand index by James Sibbet. Thomas Aspray, an experienced trader, suggests using DI in three formats, one of those was to plot the buying pressure (BP) and selling pressure (SP) as separate lines; which is what this indicator was designed to do. The green line represents the buying pressure and red line represents the selling pressure. Advantages:
The Buy and Sell Pressure indicator is available for purchase at https://www.cryptoalphaindicators.com/buy-and-sell-pressure/
- Divergences between BP or SP and price. A divergence between the BP or SP and prices suggests an approaching change in the price trend.
- Crossovers can be interpreted as bullish/bearish
- Known issues: illiquid crypto forex pairs or stocks with a very low price (i.e. 0.0000056) will cause the BP and SP to not work correctly, this can be mitigated by changing the quote currency, choosing an exchange with more volume, or changing the time-frame to a longer value.
The Buy and Sell Pressure indicator is available for purchase at https://www.cryptoalphaindicators.com/buy-and-sell-pressure/
Скрипт с ограниченным доступом
Доступ к этому скрипту разрешён только для пользователей, авторизованных автором, и для этого обычно требуется оплата. Вы можете добавить скрипт в список избранных, но использовать его можно будет только после запроса на доступ и получения разрешения от автора. Свяжитесь с CryptoAlpha_indicators, чтобы узнать больше, или следуйте инструкциям автора ниже.
TradingView не советует платить за скрипт и использовать его, если вы на 100% не доверяете его автору и не понимаете, как он работает. Часто вы можете найти хорошую альтернативу с открытым исходным кодом бесплатно в нашем разделе Скрипты сообщества.
Хотите использовать этот скрипт на графике?
Внимание: прочтите это перед тем, как запросить доступ.
Отказ от ответственности
Все виды контента, которые вы можете увидеть на TradingView, не являются финансовыми, инвестиционными, торговыми или любыми другими рекомендациями. Мы не предоставляем советы по покупке и продаже активов. Подробнее — в Условиях использования TradingView.