PROTECTED SOURCE SCRIPT
Volume direction candles - JD
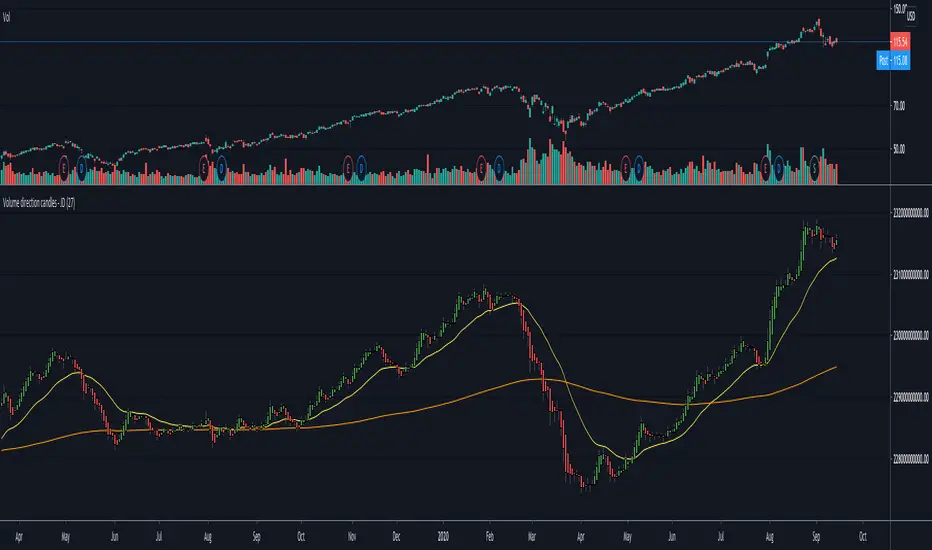
This indicator displays the inflow and outflow of money into a stock or security
and is calculated by constructing op or down candles according to the direction of price movement,
with a size corresponding to the volume size.
The ema bands can be used to find the mean total volume for the last short term and long term period
Enoy !
JD.
#DYOR
#NotTradingAdvice
and is calculated by constructing op or down candles according to the direction of price movement,
with a size corresponding to the volume size.
The ema bands can be used to find the mean total volume for the last short term and long term period
Enoy !
JD.
#DYOR
#NotTradingAdvice
Отказ от ответственности
Все виды контента, которые вы можете увидеть на TradingView, не являются финансовыми, инвестиционными, торговыми или любыми другими рекомендациями. Мы не предоставляем советы по покупке и продаже активов. Подробнее — в Условиях использования TradingView.