PROTECTED SOURCE SCRIPT
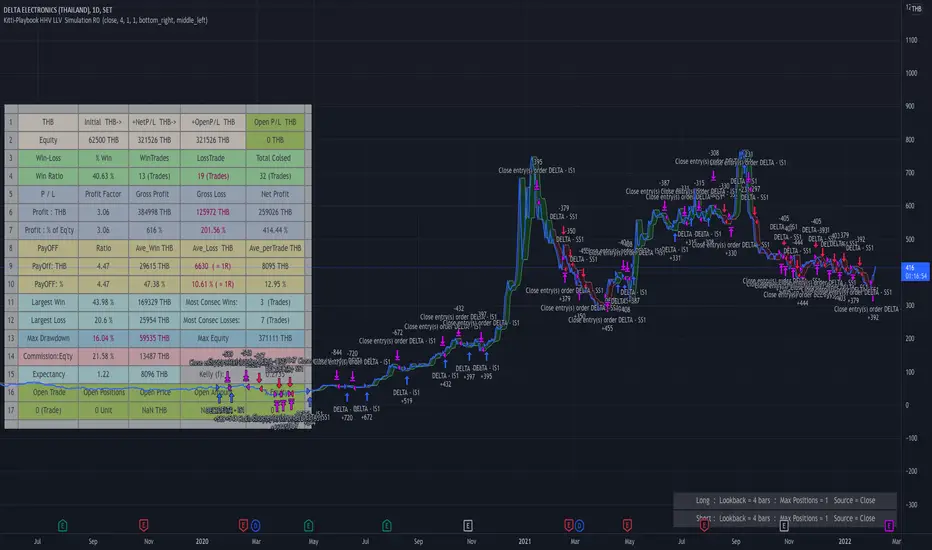
Kitti-Playbook HHV LLV Simulation R0

Feb 4 2022
Objective : Visualization the result of price movement cross Higher High - Lower Low to generate Long Short Signal
Study The change of Equity curve when Changes
1) Look back for Higher High - Lower Low
2) Number of Position size
3) Type of Suorce
4) Effected when use EMA 12-26 filter
5) Effected form equity adjustment
6) Effected form margin adjustment
Conditions :
Long Conditions
If EMA 12-26 filter off
1)Source cross over Higher High value of price look back ' x ' bars
2) Addition 1 position when Source cross over Higher High value of price look back ' x ' bars again
3) Maximum Number of Long position not more than set up from input
If EMA 12-26 filter on
1)Source cross over Higher High value of price look back ' x ' bars and EMA 12 > EMA26
2) Addition 1 position when Source cross over Higher High value of price look back ' x ' bars again and EMA 12 > EMA 26
3) Maximum Number of Long position not more than set up from input
Exit long Condition
Exit all positions when Source cross under Lower Low value of price look back ' x ' bars
Short Conditions
If EMA 12-26 filter off
1)Source cross under Lower Low value of price look back ' x ' bars
2) Addition 1 position when Source cross under Lower Lower value of price look back ' x ' bars again
3) Maximum Number of Long position not more than set up from input
If EMA 12-26 filter on
1)Source cross under Lower Lower value of price look back ' x ' bars and EMA 12 < EMA26
2) Addition 1 position when Source cross under lower Low value of price look back ' x ' bars again and EMA 12 < EMA 26
3) Maximum Number of Short position not more than set up from input
Exit Short Condition
Exit all positions when Source cross Over Higher High value of price look back ' x ' bars
Program flow :
1) Initial Strategy Setting
2) Initial Input Setting
3) Data Processing
4) STRATEGY Entry And Exit
5) Information of System selection
6) Dashboard for result
Отказ от ответственности
Все виды контента, которые вы можете увидеть на TradingView, не являются финансовыми, инвестиционными, торговыми или любыми другими рекомендациями. Мы не предоставляем советы по покупке и продаже активов. Подробнее — в Условиях использования TradingView.