PROTECTED SOURCE SCRIPT
Multiple Time Frame: RSI - Stochastic - Stochastic RSI
Developed per request.
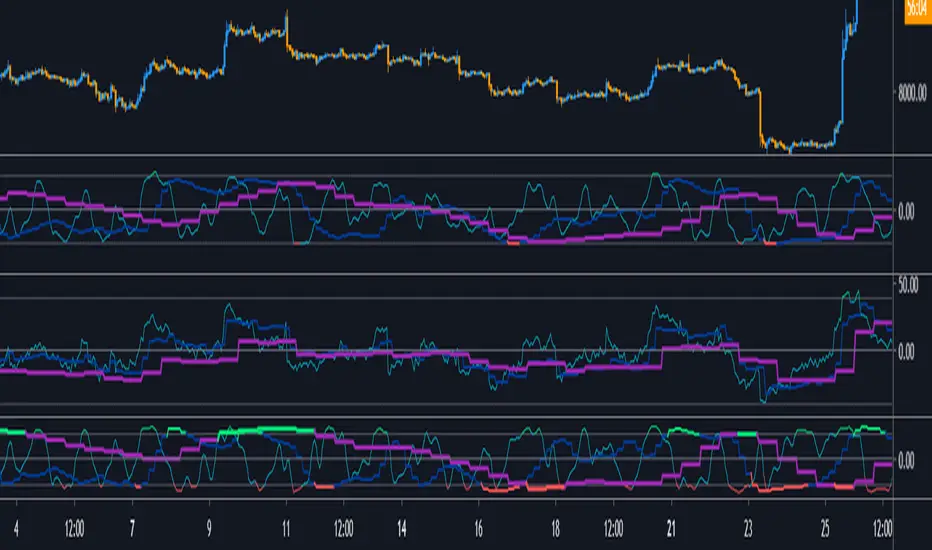
An RSI, Stochastic, and Stochastic RSI oscillator all in one.
Use the drop down selection to choose which of the 3 indicators to view. Each indicator has the option to show 3 time frames. Time frames are entered in minutes, for example, to view the 1 hour, 4 hour, and 6 hour, enter 60, 240, and 360 in the respective option windows. Currently, the indicator has the Daily as a max resolution (1440 minutes). This might be changed in a future update.
The oscillator has been centered, as opposed to the normal 0-100. There are overbought and oversold boundaries defaulted at 40 and -40, respectively. When any of the 3 main indicators cross one of these boundaries, either a green or red signal is displayed. This can be turned off in the options.
A "Total Line" and "Average Line" can be toggled on/off in the options. The "Total Line" is a simple summation of each of 3 main indicator lines. The "Average Line" is the average of the 3 main indicator lines. If you wish to only view one or both of these lines, the main 3 indicator lines can be turned off in the "Style" section of the options. The "Average" and "Total" lines do not highlight if they cross the upper and lower boundaries.
Отказ от ответственности
Все виды контента, которые вы можете увидеть на TradingView, не являются финансовыми, инвестиционными, торговыми или любыми другими рекомендациями. Мы не предоставляем советы по покупке и продаже активов. Подробнее — в Условиях использования TradingView.