PROTECTED SOURCE SCRIPT
Crazy Candle
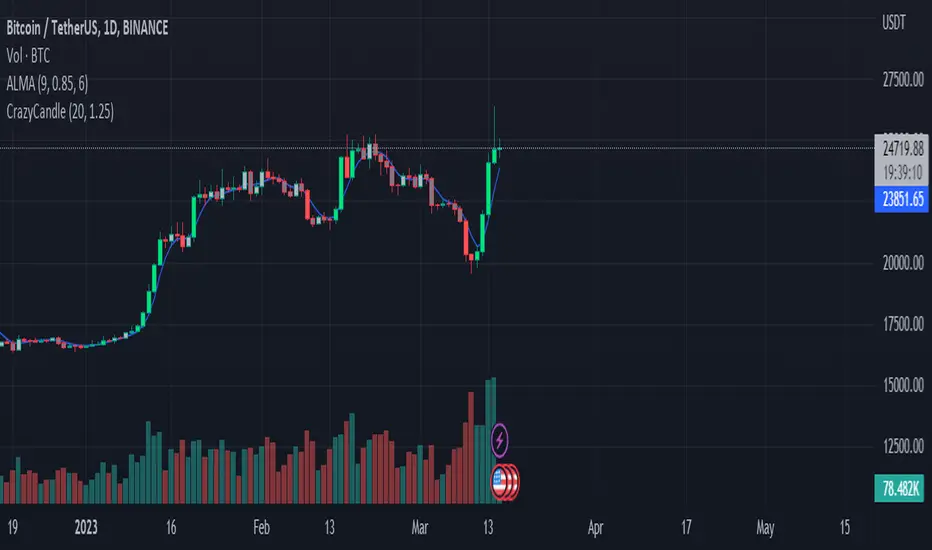
This is a volume Candle indicator. Volume Candlestick charts are created in the traditional way using open, high, low, and close data but with the addition of a volume component that determines the width of the candlestick. The greater the volume, the wider the candlestick. The colors in the Volume chart also have meaning. A green volume bar means the stock closed higher on that day versus the previous day's close. A red volume bar means the stock closed lower on that day than the previous day's close.
Отказ от ответственности
Все виды контента, которые вы можете увидеть на TradingView, не являются финансовыми, инвестиционными, торговыми или любыми другими рекомендациями. Мы не предоставляем советы по покупке и продаже активов. Подробнее — в Условиях использования TradingView.