OPEN-SOURCE SCRIPT
Imbalance FVG SIBI BISI
Обновлено
Imbalance Detection Script
Author: © teshmi9z
Script Name: Imbalance FVG
Version: Pine Script® v5
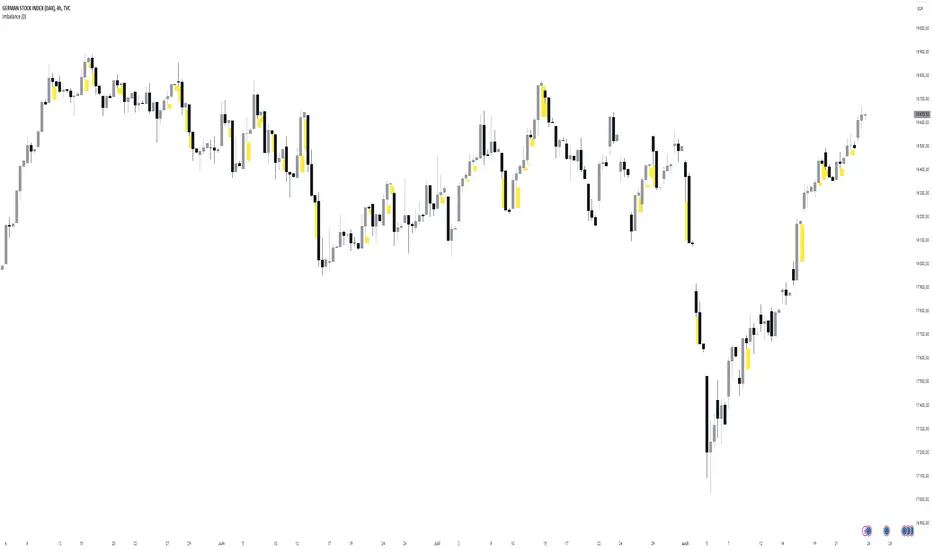
Description:
This script detects and highlights imbalances on the chart, areas where price movement has created a gap without immediate return, signaling potential zones of future support or resistance.
The script identifies two types of imbalances:
Bullish Imbalance: Occurs when the low of two bars ago is less than or equal to the previous bar's open, and the current bar's high is greater than or equal to the previous bar's close.
Bearish Imbalance: Occurs when the high of two bars ago is greater than or equal to the previous bar's open, and the current bar's low is less than or equal to the previous bar's close.
These imbalances are visualized as semi-transparent yellow boxes on the chart, which can be adjusted for transparency.
Parameters:
Transparency (FVG): Adjust the transparency of the yellow boxes, from 0 (opaque) to 100 (fully transparent).
Usage:
This script helps traders quickly identify and visualize potential reversal zones or areas of interest on the chart. It’s a useful tool for pinpointing where significant price reactions may occur.
Author: © teshmi9z
Script Name: Imbalance FVG
Version: Pine Script® v5
Description:
This script detects and highlights imbalances on the chart, areas where price movement has created a gap without immediate return, signaling potential zones of future support or resistance.
The script identifies two types of imbalances:
Bullish Imbalance: Occurs when the low of two bars ago is less than or equal to the previous bar's open, and the current bar's high is greater than or equal to the previous bar's close.
Bearish Imbalance: Occurs when the high of two bars ago is greater than or equal to the previous bar's open, and the current bar's low is less than or equal to the previous bar's close.
These imbalances are visualized as semi-transparent yellow boxes on the chart, which can be adjusted for transparency.
Parameters:
Transparency (FVG): Adjust the transparency of the yellow boxes, from 0 (opaque) to 100 (fully transparent).
Usage:
This script helps traders quickly identify and visualize potential reversal zones or areas of interest on the chart. It’s a useful tool for pinpointing where significant price reactions may occur.
Информация о релизе
Imbalance Detection ScriptAuthor: © teshmi9z
Script Name: Imbalance FVG
Version: Pine Script® v5
Description:
This script detects and highlights imbalances on the chart, areas where price movement has created a gap without immediate return, signaling potential zones of future support or resistance.
The script identifies two types of imbalances:
Bullish Imbalance: Occurs when the low of two bars ago is less than or equal to the previous bar's open, and the current bar's high is greater than or equal to the previous bar's close.
Bearish Imbalance: Occurs when the high of two bars ago is greater than or equal to the previous bar's open, and the current bar's low is less than or equal to the previous bar's close.
These imbalances are visualized as semi-transparent yellow boxes on the chart, which can be adjusted for transparency.
Parameters:
Transparency (FVG): Adjust the transparency of the yellow boxes, from 0 (opaque) to 100 (fully transparent).
Usage:
This script helps traders quickly identify and visualize potential reversal zones or areas of interest on the chart. It’s a useful tool for pinpointing where significant price reactions may occur.
Скрипт с открытым кодом
В истинном духе TradingView автор этого скрипта опубликовал его с открытым исходным кодом, чтобы трейдеры могли понять, как он работает, и проверить на практике. Вы можете воспользоваться им бесплатно, но повторное использование этого кода в публикации регулируется Правилами поведения. Вы можете добавить этот скрипт в избранное и использовать его на графике.
Отказ от ответственности
Все виды контента, которые вы можете увидеть на TradingView, не являются финансовыми, инвестиционными, торговыми или любыми другими рекомендациями. Мы не предоставляем советы по покупке и продаже активов. Подробнее — в Условиях использования TradingView.