OPEN-SOURCE SCRIPT
Grid Range Volatility Based
Обновлено
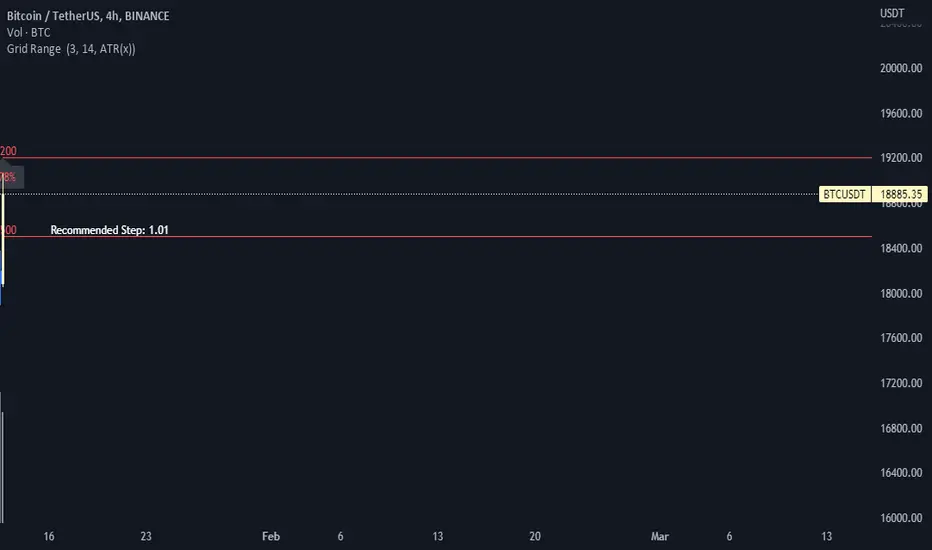
This TradingView Pine script implements a grid range volatility based indicator that displays dynamic horizontal lines on the chart. The lines are calculated based on the average true range (ATR) of the security being plotted, and the range can be adjusted using an input parameter. The distance between the top and bottom lines is displayed as a percentage in a dynamic label that updates with each new bar.
The script allows the user to choose whether to use red or black lines, and also provides options to set the number of days for range calculations, and the calculation type (either ATR(1) or ATR(x)). The script is designed to work with stocks, forex, and other securities that have price data.
To use this script, simply attach it to a chart and adjust the input parameters to suit your analysis needs. The dynamic lines and percentage label will be displayed on the chart, providing a visual representation of the range volatility of the security being plotted. The values of the highest and lowest lines can also be displayed as labels on the price axis, providing additional context for the range volatility.
Информация о релизе
Added the price labels on the levelsИнформация о релизе
Added recommended step Iter.Информация о релизе
Added Weighted Moving Average (WMA) for ATR instead of SMAСкрипт с открытым кодом
В истинном духе TradingView автор этого скрипта опубликовал его с открытым исходным кодом, чтобы трейдеры могли понять, как он работает, и проверить на практике. Вы можете воспользоваться им бесплатно, но повторное использование этого кода в публикации регулируется Правилами поведения. Вы можете добавить этот скрипт в избранное и использовать его на графике.
Отказ от ответственности
Все виды контента, которые вы можете увидеть на TradingView, не являются финансовыми, инвестиционными, торговыми или любыми другими рекомендациями. Мы не предоставляем советы по покупке и продаже активов. Подробнее — в Условиях использования TradingView.