OPEN-SOURCE SCRIPT
ADX and DI With Coloured Histogram BUY/SELL
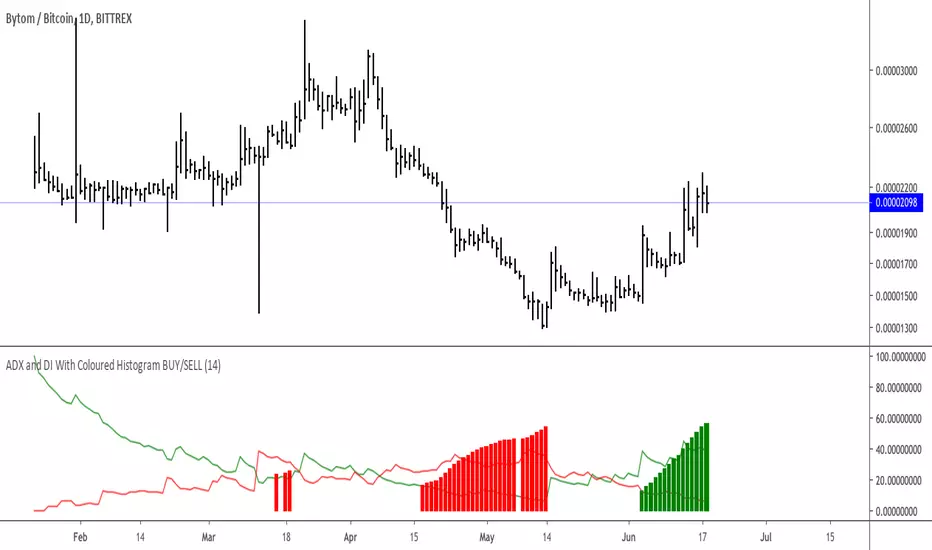
We display here the ADX has a colored histogram, which is
- green when ADX and DI+ are higher then DI-, while the ADX is increasing, meaning that we are in a potential uptrend--> we should rather be long (only buy if you have other concordant signals !)
- red when ADX and DI- are higher then DI+, while the ADX is increasing, meaning that we are in a potential downtrend --> we should rather be short (only sell if you have other concordant signals !)
- not visible if none of these conditions are met, meaning that the indicator do not show a potential trend --> don't use this indicator to buy or sell at this stage
Скрипт с открытым кодом
В истинном духе TradingView автор этого скрипта опубликовал его с открытым исходным кодом, чтобы трейдеры могли понять, как он работает, и проверить на практике. Вы можете воспользоваться им бесплатно, но повторное использование этого кода в публикации регулируется Правилами поведения. Вы можете добавить этот скрипт в избранное и использовать его на графике.
Отказ от ответственности
Все виды контента, которые вы можете увидеть на TradingView, не являются финансовыми, инвестиционными, торговыми или любыми другими рекомендациями. Мы не предоставляем советы по покупке и продаже активов. Подробнее — в Условиях использования TradingView.