OPEN-SOURCE SCRIPT
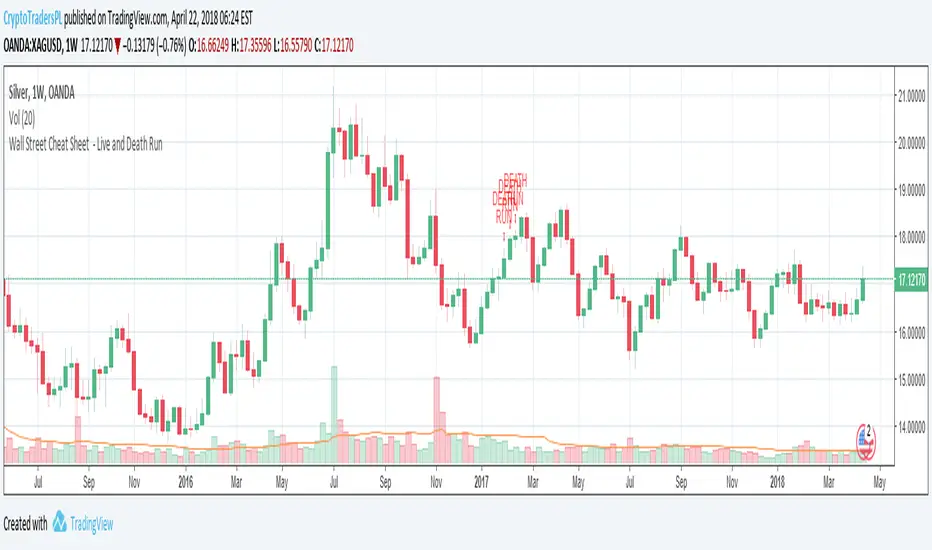
Wall Street Cheat Sheet - Live and Death Run
Hi,
This script was inspired by Wall Street Cheat Sheet and a video published by "Gold 2020 Forecast" https://www.youtube.com/watch?v=VGhan-jhnpk&t=400s.
I was trying to check if what the video claims as a unique pattern is true.
It looks like - either my script is rubbish (which might be as it's one of my first scripts in this programming environment) or this pattern it's not identified correctly.
In general this script should idnetify the euphoria phase on the market (1 or 2 down candels followed by 6 to 8 up) or the end of the depression (1 or 2 up followed by 6 to 8 down).
In my opinion those conditions do not determine and identify market phases correctly.
Скрипт с открытым кодом
В истинном духе TradingView автор этого скрипта опубликовал его с открытым исходным кодом, чтобы трейдеры могли понять, как он работает, и проверить на практике. Вы можете воспользоваться им бесплатно, но повторное использование этого кода в публикации регулируется Правилами поведения. Вы можете добавить этот скрипт в избранное и использовать его на графике.
Отказ от ответственности
Все виды контента, которые вы можете увидеть на TradingView, не являются финансовыми, инвестиционными, торговыми или любыми другими рекомендациями. Мы не предоставляем советы по покупке и продаже активов. Подробнее — в Условиях использования TradingView.