PROTECTED SOURCE SCRIPT
Candle Break
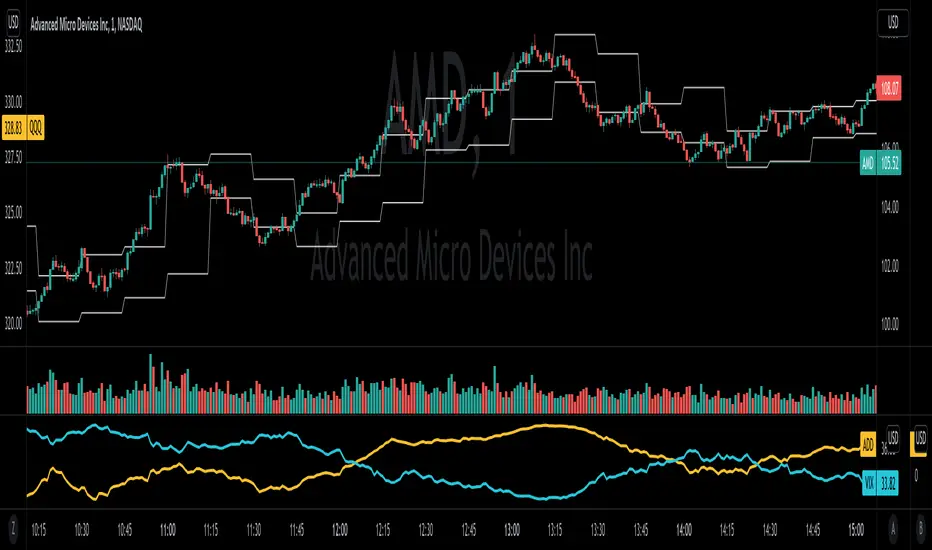
Used to draw lines on lower timeframe charts to help you identify when the candlestick breaks above or below the high and low of the candlestick in the higher timeframe.
For example, you might want to enter on the first 1-minute candle that breaks the high of the previous 5-minute candle.
This script allows you to configure any higher timeframe, so you can use for breaks on 15-minute, 1-hour, 1-day, 1-week, 1-year. As long as you have support for the timeframe, you should be able to use it.
This script only works when configuring a higher timeframe than what you're currently seeing in the chart.
Отказ от ответственности
Все виды контента, которые вы можете увидеть на TradingView, не являются финансовыми, инвестиционными, торговыми или любыми другими рекомендациями. Мы не предоставляем советы по покупке и продаже активов. Подробнее — в Условиях использования TradingView.