PROTECTED SOURCE SCRIPT
Risk indicator 50DSMA/50WSMA
Обновлено
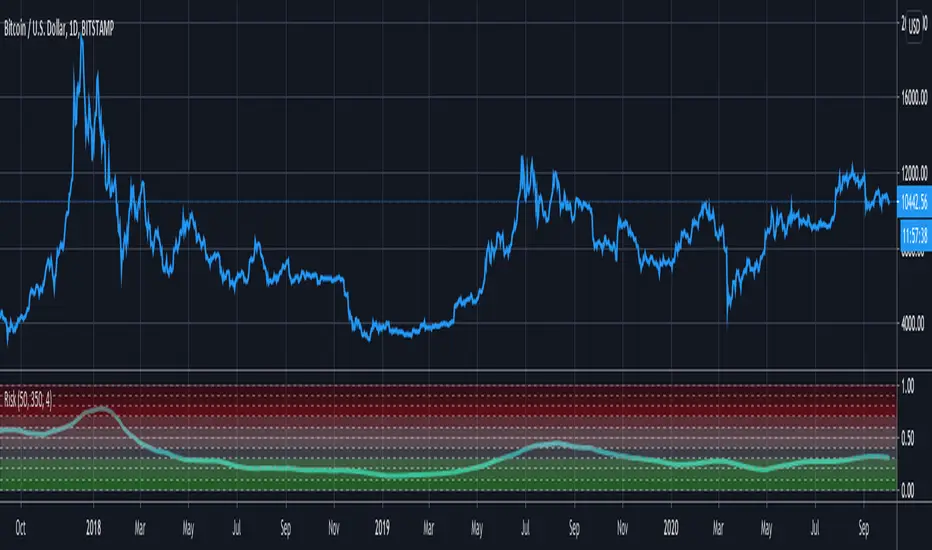
Indicates buy and sell zones, intended to be used along with your scaling-in scaling-out strategy.
Example: sell 20% of holdings in first sell zone, sell another 20% in the second zone, etc.
Example: sell 20% of holdings in first sell zone, sell another 20% in the second zone, etc.
Информация о релизе
This is more advanced version and it's more sharp/less laggingLogic has been changed a bit and visually is more like RSI indicator but it still represents amount of risk if investing in current period of time
Usage instructions
Assume you have X amount of money to invest each month (or any other period of time according to your Dollar Cost Averaging plan)
Scale in
- Buy X*3 amount in 30-40 area (Buy Zone #1)
Buy X*2 amount in 40-50 area (Buy Zone #2)
Buy X amount in 50-60 area (Buy Zone #3)
Don't do anything, just accumulate cash on your balance sheet when in 60-80 area (Indecision Zone)
Scale out
*
Sell X amount in 80-90 area (Sell Zone #1)
Sell X*2 amount in 90-100 area (Sell Zone #2)
Информация о релизе
Returned old changes back. Decided to move new changes into a separate oscillator which will have open code.Отказ от ответственности
Все виды контента, которые вы можете увидеть на TradingView, не являются финансовыми, инвестиционными, торговыми или любыми другими рекомендациями. Мы не предоставляем советы по покупке и продаже активов. Подробнее — в Условиях использования TradingView.