OPEN-SOURCE SCRIPT
(JS) VWAP Bands
Обновлено
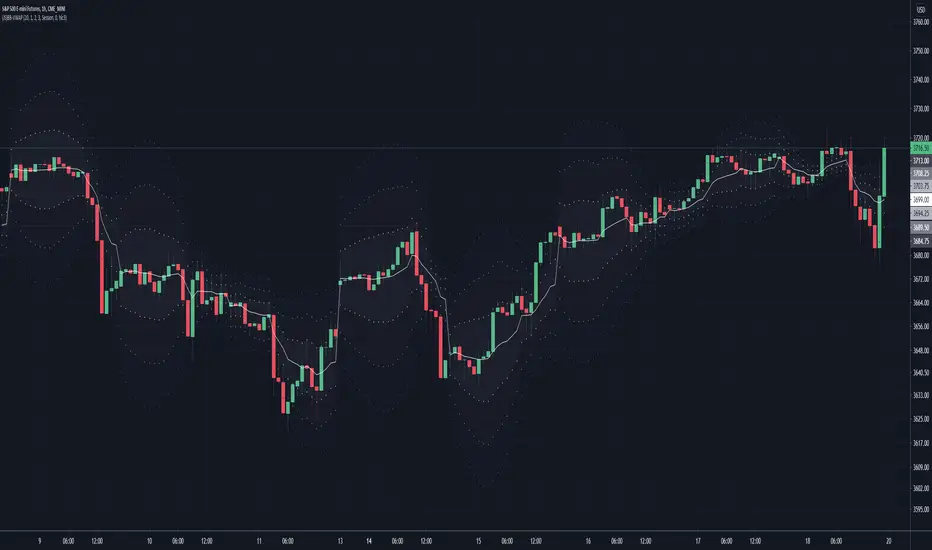
This is a pretty simple script here - I took the VWAP and combined it with Bollinger Bands.
The bands can vary a lot based on chart resolution, so I wanted to make sure the resolution could be modified so you can use the resolution you're most comfortable with, or find the most success with.
Length:
Length of bars used to calculate the bands.
Standard Deviation Band 1-3:
There's three bands all together, this option allows you to modify the number of standard deviations per band.
VWAP Period:
This modifies when you want the VWAP to begin (Session, Week, Month, Year).
Offset:
This moves the VWAP and the bands the amount of bars you select, default is of course set to zero.
Source:
This selects the source of calculation, HLC/3 is the default VWAP calculation.
This is a pretty self explanatory script, I thought being able to see the standard deviations of the VWAP could prove to be useful - hope you all like it!
Информация о релизе
...Скрипт с открытым кодом
В истинном духе TradingView автор этого скрипта опубликовал его с открытым исходным кодом, чтобы трейдеры могли понять, как он работает, и проверить на практике. Вы можете воспользоваться им бесплатно, но повторное использование этого кода в публикации регулируется Правилами поведения. Вы можете добавить этот скрипт в избранное и использовать его на графике.
Отказ от ответственности
Все виды контента, которые вы можете увидеть на TradingView, не являются финансовыми, инвестиционными, торговыми или любыми другими рекомендациями. Мы не предоставляем советы по покупке и продаже активов. Подробнее — в Условиях использования TradingView.