INVITE-ONLY SCRIPT
The Adaptive Pairwise Momentum System [QuantraSystems]
The Adaptive Pairwise Momentum System
QuantraSystems guarantees that the information created and published within this document and on the Tradingview platform is fully compliant with applicable regulations, does not constitute investment advice, and is not exclusively intended for qualified investors.
Important Note!

Even More Important Note!!
Introduction
The Adaptive Pairwise Momentum System is not just an indicator but a comprehensive asset rotation and trend-following system. In short, it aims to find the highest performing asset from the provided range.
The system dynamically optimizes capital allocation across up to four high-performing assets, ensuring that the portfolio adapts swiftly to changing market conditions. The system logic consists of sophisticated quantitative methods, rapid momentum analysis, and robust trend filtering. The overarching goal is to ensure that the portfolio is always invested in the highest-performing asset based on dynamic market conditions, while at the same time managing risk through broader market filters and internal mechanisms like volatility and beta analysis.
Legend
Core Features and Methodologies
Case Study
Notes
Overview
This case study provides an in-depth performance analysis of the Adaptive Pairwise Momentum System, a long-only system that dynamically allocates to outperforming assets and moves into cash during unfavorable conditions.
This backtest includes realistic assumptions for slippage and fees, applying a 0.5% cost for every position change, which includes both asset reallocation and moving to a cash position. Additionally, the system was tested using the top four cryptocurrencies by market capitalization as of the test start date of 01/01/2022 in order to minimize selection bias.
The top tokens on this date (excluding Stablecoins) were:
This decision was made in order to avoid cherry picking assets that might have exhibited exceptional historical performance - minimizing skew in the back test. Furthermore, although this backtest focuses on these specific assets, the system is built to be flexible and adaptable, capable of being applied to a wide range of assets beyond those initially tested.
Any potential lookahead bias or repainting in the calculations has been addressed by implementing the [barstate.isconfirmed ? 0 : 1] lookback modifier for all repainting sensitive data, including asset ratios, asset scoring, and beta values. This ensures that no future information is inadvertently used in the asset allocation process.
Additionally, a fixed lookback period of one bar is used for the trend filter during allocations - meaning that the trend filter from the prior bar must be positive for an allocation to occur on the current bar. It is also important to note that all the data displayed by the indicator is based on the last confirmed (closed) bar, ensuring that the entire system is repaint-proof.
The study spans the 2022 cryptocurrency bear market through the subsequent bull market of 2023 and 2024. The stress test highlights how the system reacted to one of the most challenging market downturns in crypto history - which includes events such as:
By incorporating these real-world challenges, the backtest provides a more accurate and robust performance evaluation that avoids overfitting or excessive optimization for one specific market condition.
The Bear Market of 2022: Stress Test and System Resilience
During the 2022 bear market, where the overall crypto market experienced deep and consistent corrections, the Adaptive Pairwise Momentum System demonstrated its ability to mitigate downside risk effectively.

The Bull Market of 2023 and 2024: Capturing Market Upside
Following the crypto bear market, the system effectively capitalized on the recovery and subsequent bull market of 2023 and 2024.

Final Summary

QuantraSystems guarantees that the information created and published within this document and on the Tradingview platform is fully compliant with applicable regulations, does not constitute investment advice, and is not exclusively intended for qualified investors.
Important Note!
- The system equity curve presented here has been generated as part of the process of testing and verifying the methodology behind this script.
- Crucially, it was developed after the system was conceptualized, designed, and created, which helps to mitigate the risk of overfitting to historical data. In other words, the system was built for robustness, not for simply optimizing past performance.
- This ensures that the system is less likely to degrade in performance over time, compared to hyper-optimized systems that are tailored to past data. No tweaks or optimizations were made to this system post-backtest.
Even More Important Note!!
- The nature of markets is that they change quickly and unpredictably. Past performance does not guarantee future results - this is a fundamental rule in trading and investing.
- While this system is designed with broad, flexible conditions to adapt quickly to a range of market environments, it is essential to understand that no assumptions should be made about future returns based on historical data. Markets are inherently uncertain, and this system - like all trading systems - cannot predict future outcomes.
Introduction
The Adaptive Pairwise Momentum System is not just an indicator but a comprehensive asset rotation and trend-following system. In short, it aims to find the highest performing asset from the provided range.
The system dynamically optimizes capital allocation across up to four high-performing assets, ensuring that the portfolio adapts swiftly to changing market conditions. The system logic consists of sophisticated quantitative methods, rapid momentum analysis, and robust trend filtering. The overarching goal is to ensure that the portfolio is always invested in the highest-performing asset based on dynamic market conditions, while at the same time managing risk through broader market filters and internal mechanisms like volatility and beta analysis.
Legend
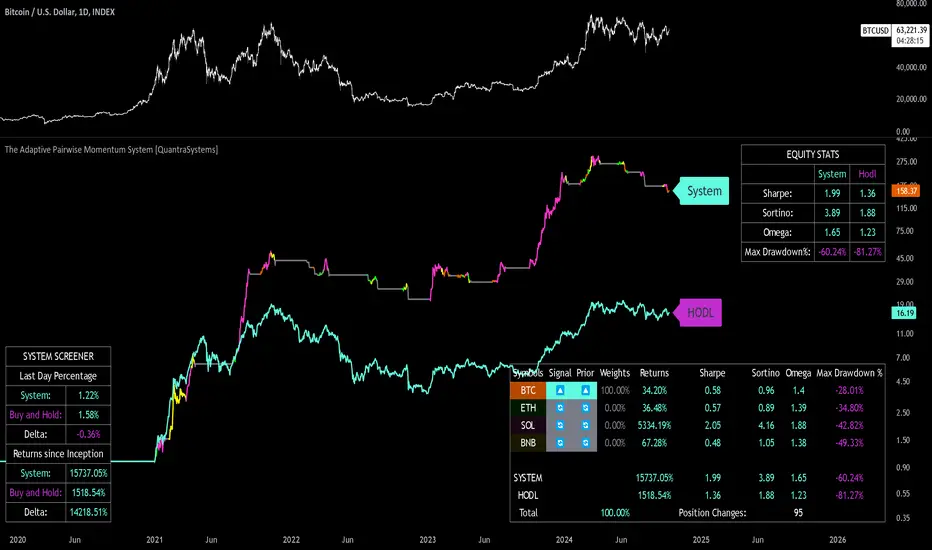
- System Equity Curve:
The equity curve displayed in the chart is dynamically colored based on the asset allocation at any given time. This color-coded approach allows traders to immediately identify transitions between assets and the corresponding impact on portfolio performance. - Highlighting of Current Highest Performer:
The current bar in the chart is highlighted based on the confirmed highest performing asset. This is designed to give traders advanced notice of potential shifts in allocation even before a formal position change occurs. The highlighting enables traders to prepare in real time, making it easier to manage positions without lag, particularly in fast-moving markets. - Highlighted Symbols in the Asset Table:
In the table displayed on the right hand side of the screen, the current top-performing symbol is highlighted. This clear signal at a glance provides immediate insight into which asset is currently being favored by the system. This feature enhances clarity and helps traders make informed decisions quickly, without needing to analyze the underlying data manually. - Performance Overview in Tables:
The left table provides insight into both daily and overall system performance from inception, offering traders a detailed view of short-term fluctuations and long-term growth. The right-hand table breaks down essential metrics such as Sharpe ratio, Sortino ratio, Omega ratio, and maximum drawdown for each asset, as well as for the overall system and HODL strategy. - Asset-Specific Signals:
The signals column in the table indicates whether an asset is currently held or being considered for holding based on the system's dynamic rankings. This is a critical visual aid for asset reallocation decisions, signaling when it may be appropriate to either maintain or change the asset of the portfolio.
Core Features and Methodologies
- Flexibility in Asset Selection
One of the major advantages of this system is its flexibility. Users can easily modify the number and type of assets included for comparison. You can quickly input different assets and backtest their performance, allowing you to verify how well this system might fit different tokens or market conditions. This flexibility empowers users to adapt the system to a wide range of market environments and tailor it to their unique preferences. - Whole System Risk Mitigation - Macro Trend Filter
One of the features of this script is its integration of a Macro-level Trend Filter for the entire portfolio. The purpose of this filter is to ensure no capital is allocated to any token in the rotation system unless Bitcoin itself is in a positive trend. The logic here is that Bitcoin, as the cryptocurrency market leader, often sets the tone for the entire cryptocurrency market. By using Bitcoins trend direction as a barometer for overall market conditions, we create a system where capital is not allocated during unfavorable or bearish market conditions - significantly reducing exposure to downside risk.
Users have the ability to toggle this filter on and off in the input menu, with five customizable options for the trend filter, including the option to use no filter. These options are:
Nova QSM - a trend aggregate combining the Rolling VWAP, Wave Pendulum Trend, KRO Overlay, and the Pulse Profiler provides the market trend signal confirmation.
Kilonova QSM - a versatile aggregate combining the Rolling VWAP, KRO Overlay, the KRO Base, RSI Volatility Bands, NNTRSI, Regression Smoothed RSI and the RoC Suite.
Quasar QSM - an enhanced version of the original RSI Pulsar. The Quasar QSM refines the trend following approach by utilizing an aggregated methodology. - Pairwise Momentum and Strength Ranking
The backbone of this system is its ability to identify the strongest-performing asset in the selected pool, ensuring that the portfolio is always exposed to the asset showing the highest relative momentum. The system continually ranks these assets against each other and determines the highest performer by measure of past and coincident outperformance. This process occurs rapidly, allowing for swift responses to shifts in market momentum, which ensures capital is always working in the most efficient manner. The speed and precision of this reallocation strategy make the script particularly well-suited for active, momentum-driven portfolios. - Beta-Adjusted Asset Selection as a Tiebreaker
In the circumstance where two (or more) assets exhibit the same relative momentum score, the system introduces another layer of analysis. In the event of a strength ‘tie’ the system will preference maintaining the current position - that is, if the previously strongest asset is now tied, the system will still allocate to the same asset. If this is not the case, the asset with the higher beta is selected. Beta is a measure of an asset’s volatility relative to Bitcoin (BTC).
This ensures that in bullish conditions, the system favors assets with a higher potential for outsized gains due to their inherent volatility. Beta is calculated based on the Average Daily Return of each asset compared to BTC. By doing this, the system ensures that it is dynamically adjusting to risk and reward, allocating to assets with higher risk in favorable conditions and lower risk in less favorable conditions. - Dynamic Asset Reallocation - Opposed to Multi-Asset Fixed Intervals
One of the standout features of this system is its ability to dynamically reallocate capital. Unlike traditional portfolio allocation strategies that may rebalance between a basket of assets monthly or quarterly, this system recalculates and reallocates capital on the next bar close (if required). As soon as a new asset exhibits superior performance relative to others, the system immediately adjusts, closing the previous position and reallocating funds to the top-ranked asset.
This approach is particularly powerful in volatile markets like cryptocurrencies, where trends can shift quickly. By reallocating swiftly, the system maximizes exposure to high-performing assets while minimizing time spent in underperforming ones. Moreover, this process is entirely automated, freeing the trader from manually tracking and measuring individual token strength.
Our research has demonstrated that, from a risk-adjusted return perspective, concentration into the top-performing asset consistently outperforms broad diversification across longer time horizons. By focusing capital on the highest-performing asset, the system captures outsized returns that are not achievable through traditional diversification. However, a more risk-averse investor, or one seeking to reduce drawdowns, may prefer to move the portfolio further left along the theoretical Capital Allocation Line by incorporating a blend of cash, treasury bonds, or other yield-generating assets or even include market neutral strategies alongside the rotation system. This hybrid approach would effectively lower the overall volatility of the portfolio while still maintaining exposure to the system’s outsized returns. In theory, such an investor can reduce risk without sacrificing too much potential upside, creating a more balanced risk-return profile. - Position Changes and Fees/Slippage
Another critical and often overlooked element of this system is its ability to account for fees and slippage. Given the increased speed and frequency of allocation logic compared to the buy-and-hold strategy, it is of vital importance that the system recognises that switching between assets may incur slippage, especially in highly volatile markets. To account for this, the system integrates realistic slippage and fee estimates directly into the equity curve, simulating expected execution costs under typical market conditions and gives users a more realistic view of expected performance. - Number of Position Changes
Understanding the number of position changes in a strategy is critical to assessing its feasibility in real world trading. Frequent position changes can lead to increased costs due to slippage and fees. Monitoring the number of position changes provides insight into the system’s behavior - helping to evaluate how active the strategy is and whether it aligns with the trader's desired time input for position management. - Equity Curve and Performance Calculations
To provide a benchmark, the script also generates a Buy-and-Hold (or "HODL") equity curve that represents an equal split across the four selected assets. This allows users to easily compare the performance of the dynamic rotation system with that of a more traditional investment strategy.
The script tracks key performance metrics for both the dynamic portfolio and the HODL strategy, including:
- Sharpe Ratio
The Sharpe Ratio is a key metric that evaluates a portfolio’s risk-adjusted return by comparing its ‘excess’ return to its volatility. Traditionally, the Sharpe Ratio measures returns relative to a risk-free rate. However, in our system’s calculation, we omit the risk-free rate and instead measure returns above a benchmark of 0%. This adjustment provides a more universal comparison, especially in the context of highly volatile assets like cryptocurrencies, where a traditional risk-free benchmark, such as the usual 3-month T-bills, is often irrelevant or too distant from the realities of the crypto market.
By using 0% as the baseline, we focus purely on the strategy's ability to generate raw returns in the face of market risk, which makes it easier to compare performance across different strategies or asset classes. In an environment like cryptocurrency, where volatility can be extreme, the importance of relative return against a highly volatile backdrop outweighs comparisons to a risk-free rate that bears little resemblance to the risk profile of digital assets.
- Sortino Ratio
The Sortino Ratio improves upon the Sharpe Ratio by specifically targeting downside risk and leaves the upside potential untouched. In contrast to the Sharpe Ratio (which penalizes both upside and downside volatility), the Sortino Ratio focuses only on negative return deviations. This makes it a more suitable metric for evaluating strategies like the Adaptive Pairwise Momentum Strategy - that aim to minimize drawdowns without restricting upside capture. By measuring returns relative to a 0% baseline, the Sortino ratio provides a clearer assessment of how well the system generates gains while avoiding substantial losses in highly volatile markets like crypto. - Omega Ratio
The Omega Ratio is calculated as the ratio of gains to losses across all return thresholds, providing a more complete view of how the system balances upside and downside risk even compared to the Sortino Ratio. While it achieves a similar outcome to the Sortino Ratio by emphasizing the system's ability to capture gains while limiting losses, it is technically a mathematically superior method. However, we include both the Omega and Sortino ratios in our metric table, as the Sortino Ratio remains more widely recognized and commonly understood by traders and investors of all levels.
- Sharpe Ratio
Case Study
Notes
- For the sake of brevity, the Important Notes section found in the header of this text will not be rewritten. Instead, it will be highlighted that now is the perfect time to reread these notes. Reading this case study in the context of what has been mentioned above is of key importance.
- As a second note, it is worth mentioning that certain market periods are referred to as either “Bull” or “Bear” markets - terms I personally find to be vague and undefinable - and therefore unfavorable. They will be used nevertheless, due to their familiarity and ease of understanding in this context. Substitute phrases could be “Macro Uptrend” or “Macro Downtrend.”
Overview
This case study provides an in-depth performance analysis of the Adaptive Pairwise Momentum System, a long-only system that dynamically allocates to outperforming assets and moves into cash during unfavorable conditions.
This backtest includes realistic assumptions for slippage and fees, applying a 0.5% cost for every position change, which includes both asset reallocation and moving to a cash position. Additionally, the system was tested using the top four cryptocurrencies by market capitalization as of the test start date of 01/01/2022 in order to minimize selection bias.
The top tokens on this date (excluding Stablecoins) were:
- Bitcoin
- Ethereum
- Solana
- BNB
This decision was made in order to avoid cherry picking assets that might have exhibited exceptional historical performance - minimizing skew in the back test. Furthermore, although this backtest focuses on these specific assets, the system is built to be flexible and adaptable, capable of being applied to a wide range of assets beyond those initially tested.
Any potential lookahead bias or repainting in the calculations has been addressed by implementing the [barstate.isconfirmed ? 0 : 1] lookback modifier for all repainting sensitive data, including asset ratios, asset scoring, and beta values. This ensures that no future information is inadvertently used in the asset allocation process.
Additionally, a fixed lookback period of one bar is used for the trend filter during allocations - meaning that the trend filter from the prior bar must be positive for an allocation to occur on the current bar. It is also important to note that all the data displayed by the indicator is based on the last confirmed (closed) bar, ensuring that the entire system is repaint-proof.
The study spans the 2022 cryptocurrency bear market through the subsequent bull market of 2023 and 2024. The stress test highlights how the system reacted to one of the most challenging market downturns in crypto history - which includes events such as:
- Luna and TerraUSD crash
- Three Arrows Capital liquidation
- Celsius bankruptcy
- Voyager Digital bankruptcy
- FTX collapse
- Silicon Valley + Signature + Silvergate banking collapses
- Subsequent USDC deppegging
- And arguably more important, 2022 was characterized by a tightening of monetary policy after the unprecedented monetary easing in response to the Covid pandemic of 2020/2021. This shift undeniably puts downward pressure on asset prices, most probably to the extent that this had a causal role to many of the above events.
By incorporating these real-world challenges, the backtest provides a more accurate and robust performance evaluation that avoids overfitting or excessive optimization for one specific market condition.
The Bear Market of 2022: Stress Test and System Resilience
During the 2022 bear market, where the overall crypto market experienced deep and consistent corrections, the Adaptive Pairwise Momentum System demonstrated its ability to mitigate downside risk effectively.
- Dynamic Allocation and Cash Exposure:
- The system rotated in and out of cash, as indicated by the gray period on the system equity curve. This allocation to cash during downtrending periods, specifically in late 2022, acted as the systems ‘risk-off’ exposure - the purest form of such an exposure. This prevented the system from experiencing the magnitude of drawdown suffered by the ‘Buy-and-Hold (HODL) investors.
- In contrast, a passive HODL strategy would have suffered a staggering 75.32% drawdown, as it remained fully allocated to chosen assets during the market's decline. The active Pairwise Momentum system’s smaller drawdown of 54.35% demonstrates its more effective capital preservation mechanisms.
The Bull Market of 2023 and 2024: Capturing Market Upside
Following the crypto bear market, the system effectively capitalized on the recovery and subsequent bull market of 2023 and 2024.
- Maximizing Market Gains:
- As trends began turning bullish in early 2023, the system caught the momentum and promptly allocated capital to only the quantified highest performing asset of the time - resulting in a parabolic rise in the system's equity curve. Notably, the curve transitions from gray to purple during this period, indicating that Solana (SOL) was the top-performing asset selected by the system.
- This allocation to Solana is particularly striking because, at the time, it was an asset many in the market shunned due to its association with the FTX collapse just months prior. However, this highlights a key advantage of quantitative systems like the one presented here: decisions are driven purely from objective data - free from emotional or subjective biases. Unlike human traders, who are inclined (whether consciously or subconsciously) to avoid assets that are ‘out of favor,’ this system focuses purely on price performance, often uncovering opportunities that are overlooked by discretionary based investors. This ability to make data-driven decisions ensures that the strategy is always positioned to capture the best risk-adjusted returns, even in scenarios where judgment might fail.
Minimizing Volatility and Drawdown in Uptrends
- While the system captured substantial returns during the bull market it also did so with lower volatility compared to HODL. The sharpe ratio of 4.05 (versus HODL’s 3.31) reflects the system's superior risk-adjusted performance. The allocation shifts, combined with tactical periods of cash holding during minor corrections, ensured a smoother equity curve growth compared to the buy-and-hold approach.
Final Summary
- The percentage returns are mentioned last for a reason - it is important to emphasize that risk-adjusted performance is paramount. In this backtest, the Pairwise Momentum system consistently outperforms due to its ability to dynamically manage risk (as seen in the superior Sharpe, Sortino and Omega ratios). With a smaller drawdown of 54.35% compared to HODL’s 75.32%, the system demonstrates its resilience during market downturns, while also capturing the highest beta on the upside during bullish phases.
- The system delivered 266.26% return since the backtest start date of January 1st 2022, compared to HODL’s 10.24%, resulting in a performance delta of 256.02%
- While this backtest goes some of the way to verifying the system’s feasibility, it’s important to note that past performance is not indicative of future results - especially in volatile and evolving markets like cryptocurrencies. Market behavior can shift, and in particular, if the market experiences prolonged sideways action, trend following systems such as the Adaptive Pairwise Momentum Strategy WILL face significant challenges.
Скрипт с ограниченным доступом
Доступ к этому скрипту разрешён только для пользователей, авторизованных автором, и для этого обычно требуется оплата. Вы можете добавить скрипт в список избранных, но использовать его можно будет только после запроса на доступ и получения разрешения от автора. Свяжитесь с QuantraSystems, чтобы узнать больше, или следуйте инструкциям автора ниже.
TradingView не советует платить за скрипт и использовать его, если вы на 100% не доверяете его автору и не понимаете, как он работает. Часто вы можете найти хорошую альтернативу с открытым исходным кодом бесплатно в нашем разделе Скрипты сообщества.
Инструкции от автора
″Get access to our Indicators: https://www.quantra.ai Join our community: https://discord.gg/FMZDM3bZ9T
Хотите использовать этот скрипт на графике?
Внимание: прочтите это перед тем, как запросить доступ.
No statements or claims aim to be financial advice,
neither are any signals from us or our indicators.
Want to learn Trading, Investing or system building?
Join the Community! 👇
discord.gg/FMZDM3bZ9T
neither are any signals from us or our indicators.
Want to learn Trading, Investing or system building?
Join the Community! 👇
discord.gg/FMZDM3bZ9T
Отказ от ответственности
Все виды контента, которые вы можете увидеть на TradingView, не являются финансовыми, инвестиционными, торговыми или любыми другими рекомендациями. Мы не предоставляем советы по покупке и продаже активов. Подробнее — в Условиях использования TradingView.