PROTECTED SOURCE SCRIPT
EMA Double - Bollinger Bands (BB) & RSI
Обновлено
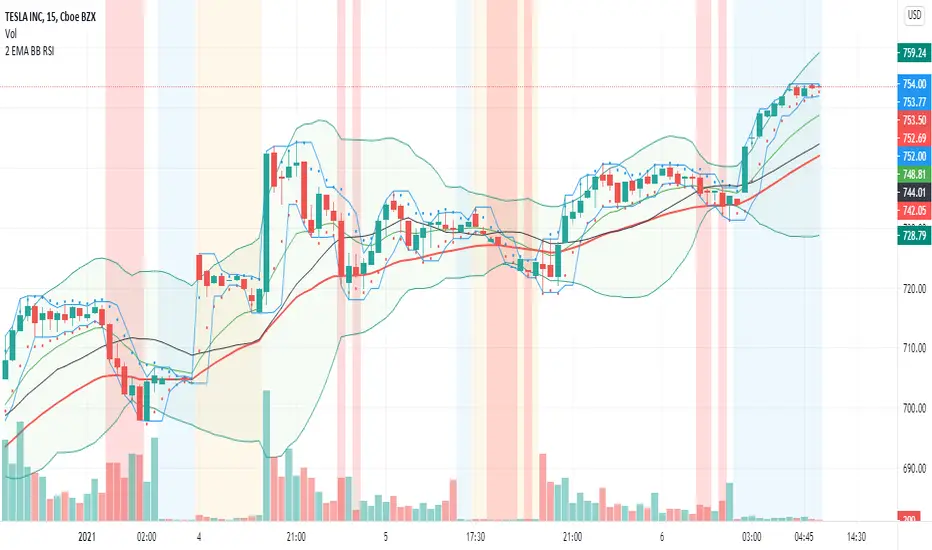
This Indicator (2 EMA -BB - RSI ) plots 2 EMA's along with Bollinger Bands and paints RSI Overbought & Oversold Zones on Chart.
RSI zones help quick identification of the overbought & oversold regions. RSI On/Off switch lets it Switch On & Off .
RSI zones help quick identification of the overbought & oversold regions. RSI On/Off switch lets it Switch On & Off .
Информация о релизе
Release 1.1Added Keltner Channel & Donchian channels for identifying volatility. Switch on KC/DC/BB Channels help to switch on/off .
The Keltner Channel is a moving average band indicator whose upper and lower bands adapt to changes in volatility by using the average true range.
The angle of the channel helps to identify trend direction. A rising channel means price has been rising, while a falling or sideways channel indicates price has been falling or moving sideways, respectively.
Keltner Channels use ATR to calculate the bands. Bollinger Bands use standard deviation instead.
The Donchian channel is an indicator used in market trading developed by Richard Donchian. It is formed by taking the highest high and the lowest low of the last n periods.
Информация о релизе
Published with Indicator specific chart.Отказ от ответственности
Все виды контента, которые вы можете увидеть на TradingView, не являются финансовыми, инвестиционными, торговыми или любыми другими рекомендациями. Мы не предоставляем советы по покупке и продаже активов. Подробнее — в Условиях использования TradingView.