PROTECTED SOURCE SCRIPT
Enlighten-Trade
Обновлено
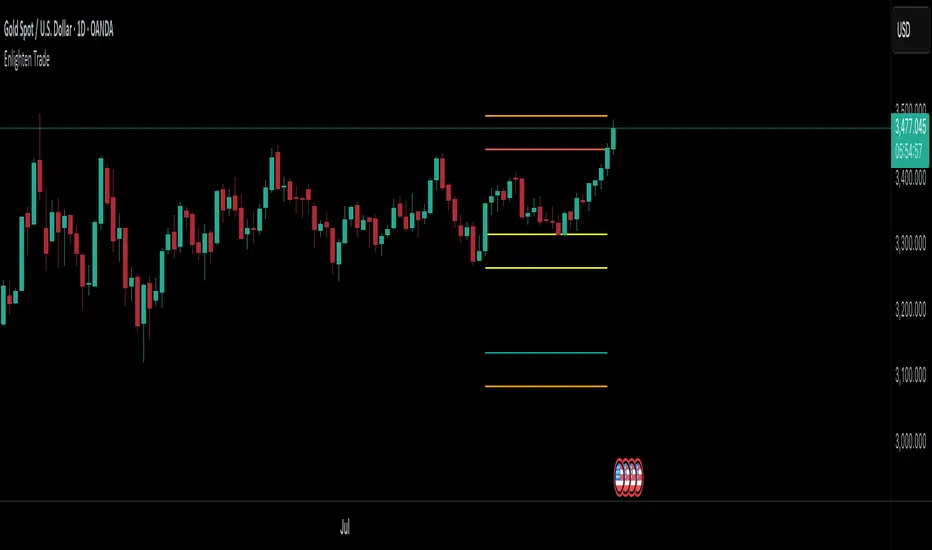
Technical analysts use support and resistance levels to identify price points on a chart to find probabilities to trade a prevailing trend.
This indicator plots dynamic support and resistance based on price range (all time frames).
Indicator will plot S1, S2, S3, S4 - P - R1, R2, R3, R4 (S = Support, R = Resistance & P = Pivot )
Support breaks when a downtrend was started and price will go below the support level.
Resistance breaks when a uptrend was started and price will go above the support level.
Breakouts provide possible trading opportunities. A breakout to the upside signals traders to possible get long or cover short positions. A breakout to the downside signals traders to possibly get short or to sell long positions.
Breakouts can be subjective since not all traders will recognize or use support and resistance levels.
This indicator shows Dynamic Support & Resistance Levels.
Информация о релизе
Technical analysts use support and resistance levels to identify price points on a chart to find probabilities to trade a prevailing trend. This indicator plots dynamic support and resistance based on price range (all time frames).
Indicator will plot S1, S2, S3, S4 - P - R1, R2, R3, R4 (S = Support, R = Resistance & P = Pivot )
Support breaks when a downtrend was started and price will go below the support level.
Resistance breaks when a uptrend was started and price will go above the resistance level.
Breakouts provide possible trading opportunities. A breakout to the upside signals traders to possible get long or cover short positions. A breakout to the downside signals traders to possibly get short or to sell long positions.
Breakouts can be subjective since not all traders will recognize or use support and resistance levels.
This indicator shows Dynamic Support & Resistance Levels.
Информация о релизе
GUIDE TO USE ENLIGHTEN-TRADE INDICATORENLIGHTEN-TRADE CAN BE ADDED TO CHART BY SEARCHING THE INDICATOR NAME ENLIGHTEN-TRADE IN THE INDICATOR SECTION IN TRADING VIEW.
LONG (BUY)
1. BUY AFTER BREAKOUT OF R1 (CANDLE CLOSES THE R1 —— RED-COLOURED).
2. TARGET MAY BE R2, R3, R4 —— YELLOW-COLOURED.
3. STOP LOSS MAY BE (P) —— BLUE -COLOURED.
4. OVERBOUGHT CONFORMATION —— YELLOW-COLOURED CANDLES.
SHORT (SELL)
1. SELL AFTER THE BREAKOUT OF S1 (CANDLE CLOSES S1 —— GREEN-COLOURED).
2. TARGET MAY BE S2, S3, S4 —— PURPLE-COLOURED.
3. STOP LOSS MAY BE (P) - BLUE —— COLOURED.
4. OVERSOLD CONFORMATION — — PINK-COLOURED CANDLES.
THE ULTIMATE GOAL OF USING OUR INDICATOR IS TO FIND HIGH PROBABILITY TRADE SETUPS, OUR TOOL SHOWS IT IN A BEAUTIFUL MANNER.
MASTERING A THING WILL NEED DEDICATION AND TIME, SO WE HAVE SPEND TIME WITH THE INDICATOR AND MARKET TO MASTER IT.
INTERPRETING TRADE SETUPS:-
1. IDENTIFYING OPPORTUNITY OF A TRADE SETUP AND WAIT FOR THE BREAKOUT.
2. IF TRADE SETUP WAS REJECTED IT WILL FOLLOW THE OPPOSITE SETUP OR IT WILL CREATE A NEW SETUP.
3. IF PRICE IS BETWEEN THE TWO SETUPS - MARKET WILL BE IN SIDEWAYS.
4. ON SIDEWAYS AVOID TAKING ANY TRADE, MARK THE BREAKOUT PRICE AS AN ALERT AND STAY AWAY FROM THE SCRIPT.
TIME FRAMES ARE MOST IMPORTANT:-
1. DON’T STICK WITH ONE SETUP, ONE TIME FRAME & ONE SCRIPT.
2. HIGER TIME FRAME IS NOT FOR INTRADAY TRADERS TO TAKE TRADES.
3. M1 - H4 IS THE MINIMUM AND MAXIMUM.
4. REST OF THE TIME FRAMES ARE ANALYSIS ONLY FOR INTRADAY TRADER.
MONEY / RISK MANAGEMENT:-
1. TAKE RISK UPT TO 0.5% - 2.5% OF YOUR CAPITAL FOR A TRADE.
2. DECIDE YOUR ENTRY, STOP LOSS AND TAKE PROFIT ON YOUR OWN.
3. PLACE PROPER STOP LOSS AND TAKE PROFIT.
4. MAKE YOURSELF AVAILABLE WHEN YOUR TRADE IS LIVE.
5. STICK WITH YOUR TRADE DISCIPLINE.
HAPPY TRADING & ALL THE VERY BEST.
Информация о релизе
Enhancements DoneИнформация о релизе
Enhancements Done...Stop Loss for buy yellow coloured
Stop Loss for sell aqua coloured
Информация о релизе
Enhancements DoneИнформация о релизе
Enhancements Done...Информация о релизе
Enhancements Done...Информация о релизе
Enhancements Done..Информация о релизе
Enhancements Done...Информация о релизе
UpdatedИнформация о релизе
Update to Pine Script V5Updated Support & Resistance from Daily, Weekly, Monthly and Yearly.
Информация о релизе
Colors of Support & Resistance were update.Close Price & Mid-Point were updated to Aqua Color.
Информация о релизе
Support & Resistance added for addition five intervals.Информация о релизе
NEW UPDATE INSTRUCTIONSHERE AFTER FOLLOW THE NEW INSTRUCTIONS GIVEN BELOW & DO NOT FOLLOW THE PREVIOUS INSTRUCTIONS.
Instructions to Use Standard Deviation Support and Resistance in Trading
Step-by-Step Guide
Chosen Time Period: -
According to your trading Style.
Calculate the mean high and low prices over the chosen period.
Compute the deviations of each day's high and low from their respective means.
Square these deviations, calculate their mean, and take the square root to get the standard .
Back-Testing:-
Test the strategy on historical data to ensure its effectiveness before applying it in live trading.
Monitor Price Action:-
Track the current price in relation to the calculated support and resistance levels. Make Trading Decisions Based on Crossings Standard Deviation SNR
Bullish Setup:-
Enter a long (Buy) position if the price crosses above the resistance level with (Strong Green Color Candlestick).
Bearish Setup:-
Enter a short (Sell) position if the price crosses below the support level with (Strong Red Color Candlestick).
No Action Setup
No action required if the price crosses below/above the support level with (Gray Color Candlestick).
Combine with Other Indicators:-
Use additional technical indicators (e.g., Volume Moving Averages, Stochastic, RSI) to confirm signals.
Be Aware of Market Conditions:-
Adjust your strategy for different market conditions (trending vs. ranging markets).
Risk Management
Set Stop-Loss Orders:-
Always use stop-loss orders to protect against significant losses. Plan according to your money management and risk management perspective. Adjust Positions as Needed
Trailing Stop:-
Use trailing stops to lock in profits as the price moves in your favour protect profits.
Standard Deviation Support and Resistance Levels are regularly updated based on the latest available data to adapt to changing market conditions.
By following these instructions and continuous efforts, you can effectively make informed trading decisions.
Информация о релизе
Updates done. Best Wishes.Информация о релизе
Historical Levels RemovedMomentum Conditions Updated
Отказ от ответственности
Все виды контента, которые вы можете увидеть на TradingView, не являются финансовыми, инвестиционными, торговыми или любыми другими рекомендациями. Мы не предоставляем советы по покупке и продаже активов. Подробнее — в Условиях использования TradingView.