INVITE-ONLY SCRIPT
Financials based on Piotroski F-Score
Обновлено
Financials based on Piotroski F-Score includes 2 languages : Vietnamese and English

Select Quarterly or Annual Financial Statements:
Select Quarterly Report

Select Annual Financial Statements

Convert to billions:

Note the abbreviations:
1. Rev: Total revenue
2. Gross: Gross profit (Gross Margin)
3. OI: Operating Income
4. Net: Net Income (Net Margin)
5. FCO: Cash From Operating Activities
6. ROA: Return on assets
7. C: Deferred Income, Current
8. N: Deferred Income, Non-Current
9. TAS: Total assets (Asset turnover)
10. Debt: Total liabilities
11. E: Debt to EBITDA ratio
12. L_debt: Long term debt to total assets ratio
13. Cur: Current ratio
14. INV: Total inventories (Inventory turnover)
15. TSO: Total Shares Outstanding (Diluted EPS )
16. Graham: Graham's number (close/Graham's number)
17. F_score: Piotroski F-score

Select item Financials on chart:

Manual Financials based on Piotroski F-Score:
The Piotroski F-Score is the sum of 9 components related to profitability, leverage and op. efficiency. These nine components are each given a pass (1) or fail (0). The sum of these parts results in the F-Score. For each criteria that a company meets, it's F-Score is increased by 1.
Profitability Components
- Positive Net Income -> 1
- Positive Operating Cash Flow -> 1
- Higher ROA than Previous Period -> 1
- CFO > NI -> 1
Leverage Components
- Decline in Long Term Debt -> 1
- Higher Current Ratio than Previous Period ->1
- Less Dilution (# of Shares Outstanding) than Previous Period -> 1
Operating Efficiency Components
- Higher Gross Margin than Previous Period -> 1
- Higher Asset Turnover than Previous Period -> 1
If you invested in only those companies that scored best or highest (8 or 9) on his nine-point scale, or F-Score as he called it, over the 20 year period from 1976 to 1996, you would have outperformed the market by an average of 13.4% per year - and this over 20 years!
That sounds just about too good to be true. But it is true!

Select Quarterly or Annual Financial Statements:
Select Quarterly Report
Select Annual Financial Statements
Convert to billions:
Note the abbreviations:
1. Rev: Total revenue
2. Gross: Gross profit (Gross Margin)
3. OI: Operating Income
4. Net: Net Income (Net Margin)
5. FCO: Cash From Operating Activities
6. ROA: Return on assets
7. C: Deferred Income, Current
8. N: Deferred Income, Non-Current
9. TAS: Total assets (Asset turnover)
10. Debt: Total liabilities
11. E: Debt to EBITDA ratio
12. L_debt: Long term debt to total assets ratio
13. Cur: Current ratio
14. INV: Total inventories (Inventory turnover)
15. TSO: Total Shares Outstanding (Diluted EPS )
16. Graham: Graham's number (close/Graham's number)
17. F_score: Piotroski F-score
Select item Financials on chart:
Manual Financials based on Piotroski F-Score:
The Piotroski F-Score is the sum of 9 components related to profitability, leverage and op. efficiency. These nine components are each given a pass (1) or fail (0). The sum of these parts results in the F-Score. For each criteria that a company meets, it's F-Score is increased by 1.
Profitability Components
- Positive Net Income -> 1
- Positive Operating Cash Flow -> 1
- Higher ROA than Previous Period -> 1
- CFO > NI -> 1
Leverage Components
- Decline in Long Term Debt -> 1
- Higher Current Ratio than Previous Period ->1
- Less Dilution (# of Shares Outstanding) than Previous Period -> 1
Operating Efficiency Components
- Higher Gross Margin than Previous Period -> 1
- Higher Asset Turnover than Previous Period -> 1
If you invested in only those companies that scored best or highest (8 or 9) on his nine-point scale, or F-Score as he called it, over the 20 year period from 1976 to 1996, you would have outperformed the market by an average of 13.4% per year - and this over 20 years!
That sounds just about too good to be true. But it is true!
Информация о релизе
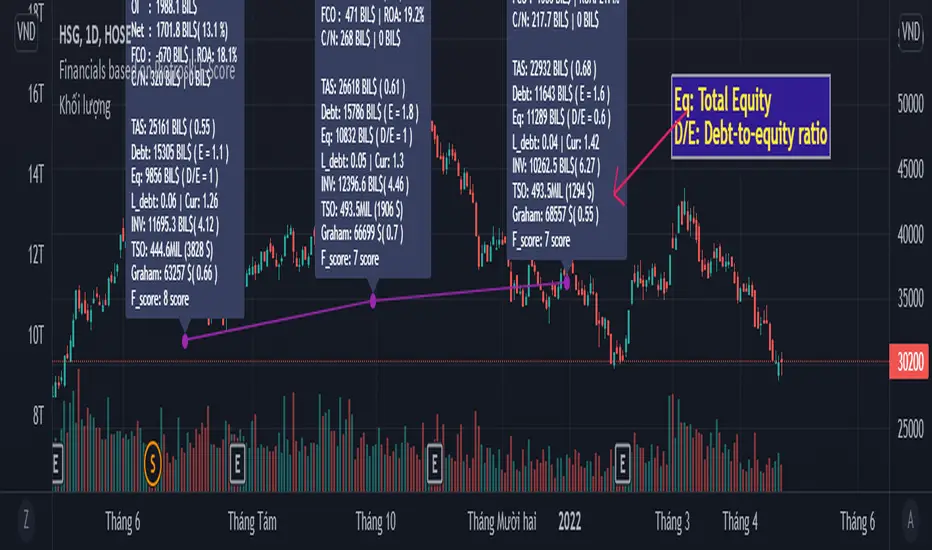
Update Total Equity and Debt-to-equity ratio.Eq: Total Equity
D/E : Debt-to-equity ratio
Скрипт с ограниченным доступом
Доступ к этому скрипту разрешён только для пользователей, авторизованных автором, и для этого обычно требуется оплата. Вы можете добавить скрипт в список избранных, но использовать его можно будет только после запроса на доступ и получения разрешения от автора. Свяжитесь с thiendongminZ, чтобы узнать больше, или следуйте инструкциям автора ниже.
TradingView does not suggest paying for a script and using it unless you 100% trust its author and understand how the script works. In many cases, you can find a good open-source alternative for free in our Community Scripts.
Хотите использовать этот скрипт на графике?
Внимание: прочтите это перед тем, как запросить доступ.
Отказ от ответственности
Все виды контента, которые вы можете увидеть на TradingView, не являются финансовыми, инвестиционными, торговыми или любыми другими рекомендациями. Мы не предоставляем советы по покупке и продаже активов. Подробнее — в Условиях использования TradingView.