OPEN-SOURCE SCRIPT
Candle Closing Strength Indicator (CCS)
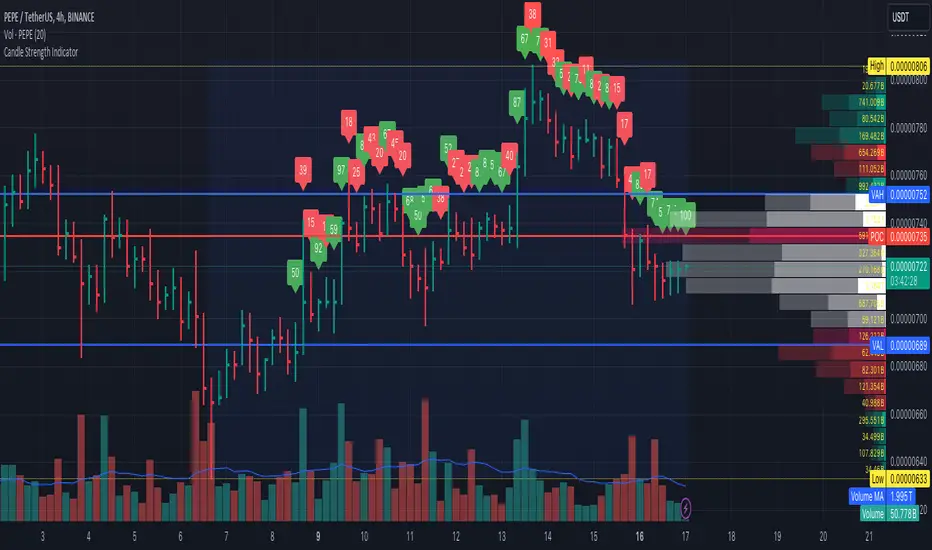
This indicator measures and displays the closing strength of each candle relative to its range.
It assigns a value from 0 to 100, where
- 0 indicates a close at the candle's low,
- 100 indicates a close at the high, and
- 50 represents a close at the midpoint.
The strength is shown as a number on each candle, color-coded green for values 50 and above (bullish) and red for values below 50 (bearish). This visual representation helps traders quickly assess the strength and direction of price movements across different timeframes.
This is only the price action strength. Further strength can be verified with volume.
Скрипт с открытым кодом
В истинном духе TradingView автор этого скрипта опубликовал его с открытым исходным кодом, чтобы трейдеры могли понять, как он работает, и проверить на практике. Вы можете воспользоваться им бесплатно, но повторное использование этого кода в публикации регулируется Правилами поведения. Вы можете добавить этот скрипт в избранное и использовать его на графике.
Отказ от ответственности
Все виды контента, которые вы можете увидеть на TradingView, не являются финансовыми, инвестиционными, торговыми или любыми другими рекомендациями. Мы не предоставляем советы по покупке и продаже активов. Подробнее — в Условиях использования TradingView.