OPEN-SOURCE SCRIPT
K's Reversal Indicator III
K's Reversal Indicator III is based on the concept of autocorrelation of returns. The main theory is that extreme autocorrelation (trending) that coincide with a technical signals such as one from the RSI, may result in a powerful short-term signal that can be exploited.
The indicator is calculated as follows:
1. Calculate the price differential (returns) as the current price minus the previous price.
2. the correlation between the current return and the return from 14 periods ago using a lookback of 14 periods.
3. Calculate a 14-period RSI on the close prices.
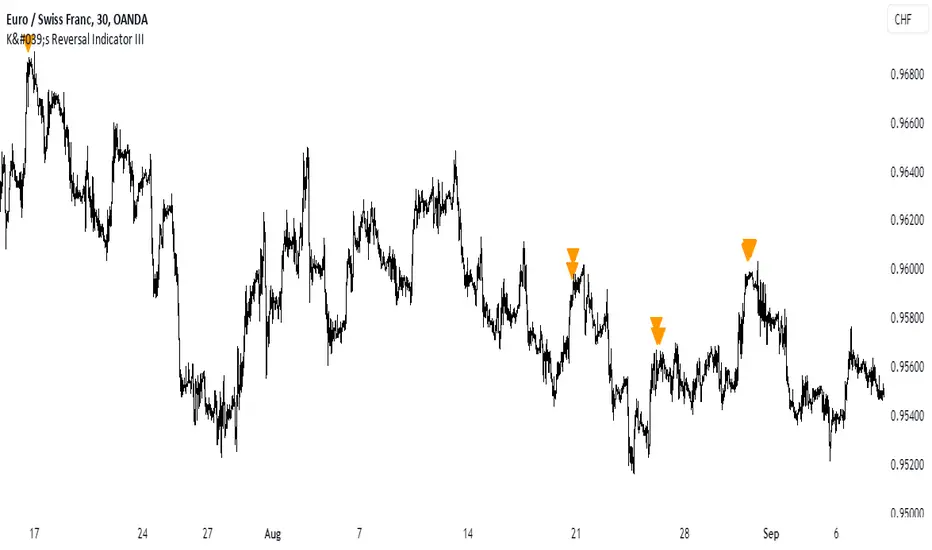
To generate the signals, use the following rules:
* A bullish signal is generated whenever the correlation is above 0.60 while the RSI is below 40.
* A bearish signal is generated whenever the correlation is above 0.60 while the RSI is above 60.
The indicator is calculated as follows:
1. Calculate the price differential (returns) as the current price minus the previous price.
2. the correlation between the current return and the return from 14 periods ago using a lookback of 14 periods.
3. Calculate a 14-period RSI on the close prices.
To generate the signals, use the following rules:
* A bullish signal is generated whenever the correlation is above 0.60 while the RSI is below 40.
* A bearish signal is generated whenever the correlation is above 0.60 while the RSI is above 60.
Скрипт с открытым кодом
В истинном духе TradingView автор этого скрипта опубликовал его с открытым исходным кодом, чтобы трейдеры могли понять, как он работает, и проверить на практике. Вы можете воспользоваться им бесплатно, но повторное использование этого кода в публикации регулируется Правилами поведения. Вы можете добавить этот скрипт в избранное и использовать его на графике.
Отказ от ответственности
Все виды контента, которые вы можете увидеть на TradingView, не являются финансовыми, инвестиционными, торговыми или любыми другими рекомендациями. Мы не предоставляем советы по покупке и продаже активов. Подробнее — в Условиях использования TradingView.