OPEN-SOURCE SCRIPT
Time Matrix Table
Обновлено
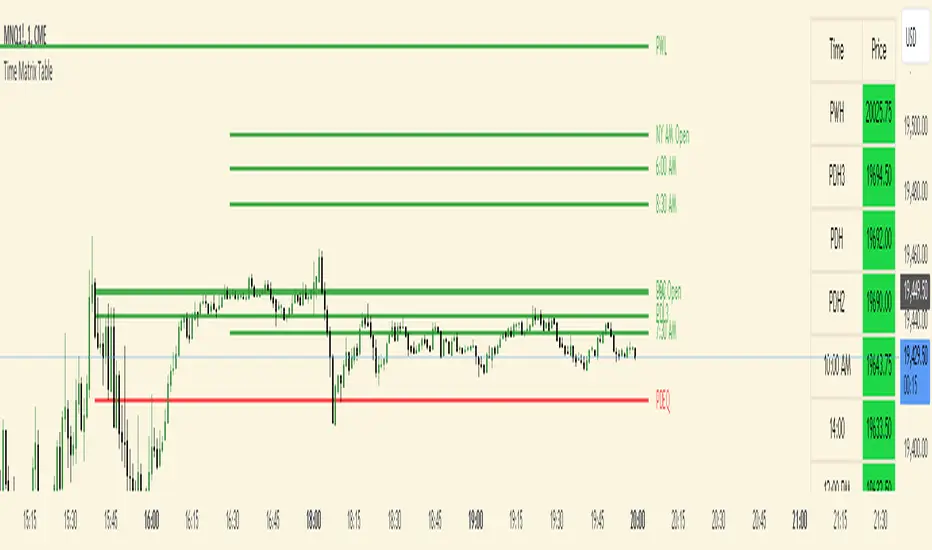
ICT stresses time and liquidity levels in his teachings. This table helps to easily locate these key Time-based price levels. You can use these levels to determine your directional bias and to help generate your narrative for where the market is going.
This indicator creates a table that gives you the price for the following liquidity levels:
PDO - Previous Day Open
PDH - Previous Day High
PDL - Previous Day Low
PDC - Previous Day Close
PDEQ - Equilibrium of the previous day's range. (Calculated by math.abs(((pdh-pdl)/2)+pdl))
PWH - Previous Week High
PWL - Previous Week Low
PDH2 - Two Days Back High
PDL2 - Two Days Back Low
PDH3 - Three Days Back High
PDL3 - Three Days Back Low
And gives you the opening price for the following times:
Daily Open - 6:00pm open for current session
1:30 AM
3:00 AM
4:00 AM
Midnight Open
6:00 AM
7:30 AM
8:30 AM
NY Open
10:00 AM
12:00 PM
NY PM - 1:30pm
2:00 PM
The levels are sorted descending in price in the table, with the background colored based on their relation to price. The prices are also plotted on the chart based on the range you specify in relation to the current price. These lines are also colored based on their relation to price.
This indicator does not give you anything but the price at a specific time, you must determine your own bias and narrative based on the levels that are given.
Информация о релизе
** UPDATE ** The indicator now runs on the seconds chart. Информация о релизе
*Update* Updated the name in the status bar and added current price in the table with the ability to give it unique color.Информация о релизе
Minor fix for line labelsИнформация о релизе
Added the ability to hide the table.Информация о релизе
**Updated script to allow for 12 custom Times and Prices to be input for the table. Comes pre-loaded with the ICT time matrix. Some cleaning up.Информация о релизе
Added the ability to show Weekly, Daily, and Session lines individually.Changed distance to show lines from points to ticks.
Информация о релизе
Finalized Label LocationСкрипт с открытым кодом
В истинном духе TradingView автор этого скрипта опубликовал его с открытым исходным кодом, чтобы трейдеры могли понять, как он работает, и проверить на практике. Вы можете воспользоваться им бесплатно, но повторное использование этого кода в публикации регулируется Правилами поведения. Вы можете добавить этот скрипт в избранное и использовать его на графике.
Отказ от ответственности
Все виды контента, которые вы можете увидеть на TradingView, не являются финансовыми, инвестиционными, торговыми или любыми другими рекомендациями. Мы не предоставляем советы по покупке и продаже активов. Подробнее — в Условиях использования TradingView.