OPEN-SOURCE SCRIPT
Standard Deviation based Upper Lower Range
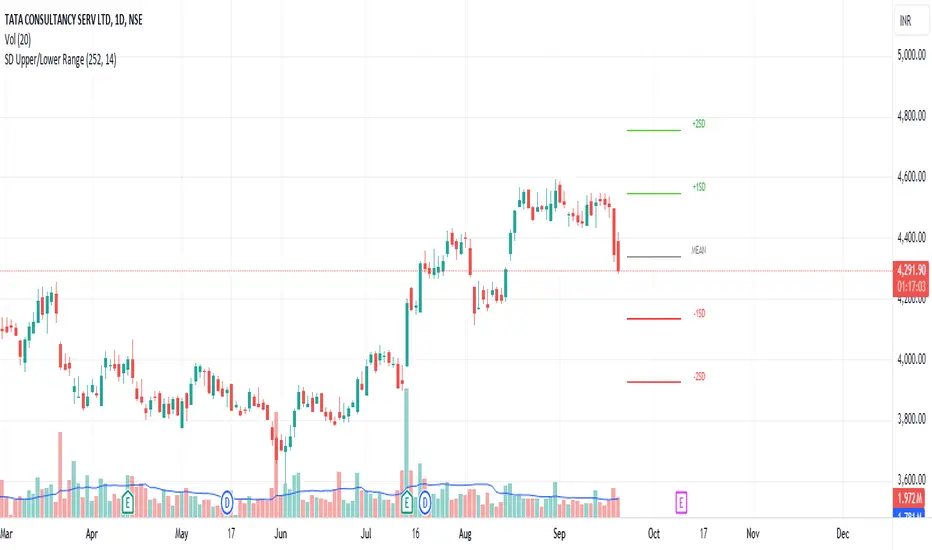
This script makes use of historical data for finding the standard deviation on daily returns. Based on the mean and standard deviation, the upper and lower range for the stock is shown upto 2x standard deviation. These bounds can be treated as volatility range for the next n trading sessions. This volatility is based on historical data. Users can change the lookback historical period, and can also set the time period (days) for upcoming trading sessions.
This indicator can be useful in determining stoploss and target levels along with the traditional support/resistance levels. It can also be useful in option trading where one needs to determine a range beyond which it is safe to sell an option.
A range of 1 SD has around 65% to 68% probability that it will not be breached. A range of 2 SD has around 95% probability that it will not be breached.
The indicator is based on Normal distribution theory. In future editions, I envision to also calculate the skewness and kurtosis so that we can determine if a stock is properly following Normal Distribution theory. That may further favor the calculated range.
Скрипт с открытым кодом
В истинном духе TradingView автор этого скрипта опубликовал его с открытым исходным кодом, чтобы трейдеры могли понять, как он работает, и проверить на практике. Вы можете воспользоваться им бесплатно, но повторное использование этого кода в публикации регулируется Правилами поведения. Вы можете добавить этот скрипт в избранное и использовать его на графике.
Отказ от ответственности
Все виды контента, которые вы можете увидеть на TradingView, не являются финансовыми, инвестиционными, торговыми или любыми другими рекомендациями. Мы не предоставляем советы по покупке и продаже активов. Подробнее — в Условиях использования TradingView.