OPEN-SOURCE SCRIPT
Better OBV
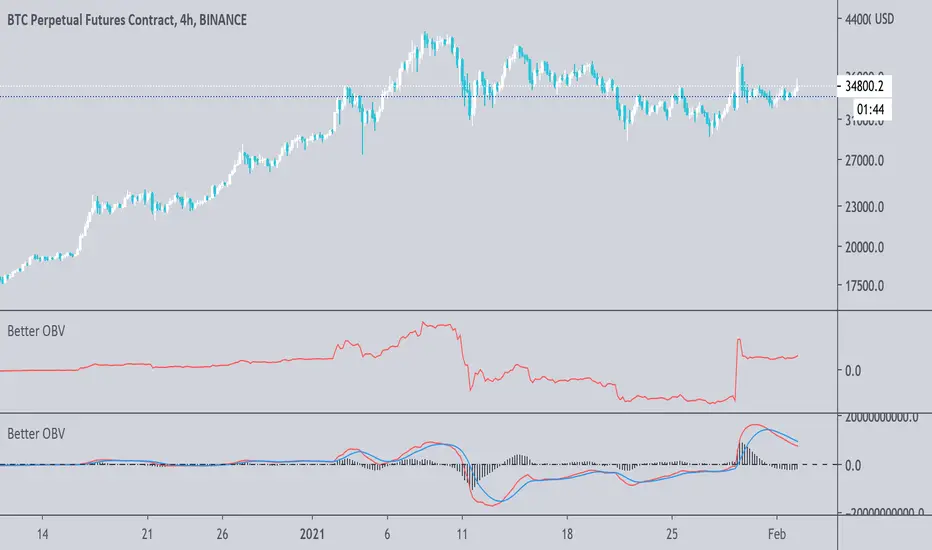
OBV with William C. Garrett's Approximation
In the classical OBV (On-Balance Volume) indicator, it simply takes the idea from traditional tape reading - treat the "up tick" as Buy, "down tick" as Sell, and it assumes no change in price as neutral* (*which is not the case in tape reading).
When it comes to interpret the daily volume as such, errors will add up cumulatively. For example, there are days when a Doji Star with high volume just merely one cent higher than yesterday price and the whole day volume would be taken as a BUY Volume....
Here is a gentlemen, William C. Garrett, attempted to break down the daily volume into two parts in his book - "Torque Analysis of Stock Market Cycle".
Published indicator has two modes: Cumulative and Time Segmented. Time Segmented Volume (TSV) - performs a MACD operation on the Garrett Money Flow.
Note on Divergence:
When using a indicator as Time Segmented Money Flow, divergence would surely occur on and off. This is where Wyckoff 3rd principle comes into play - "Effort vs Result" that is not matching. Meaning that the cumulation of shares goes in one direction while the price goes another direction.
Скрипт с открытым кодом
В истинном духе TradingView автор этого скрипта опубликовал его с открытым исходным кодом, чтобы трейдеры могли понять, как он работает, и проверить на практике. Вы можете воспользоваться им бесплатно, но повторное использование этого кода в публикации регулируется Правилами поведения. Вы можете добавить этот скрипт в избранное и использовать его на графике.
Отказ от ответственности
Все виды контента, которые вы можете увидеть на TradingView, не являются финансовыми, инвестиционными, торговыми или любыми другими рекомендациями. Мы не предоставляем советы по покупке и продаже активов. Подробнее — в Условиях использования TradingView.