PROTECTED SOURCE SCRIPT
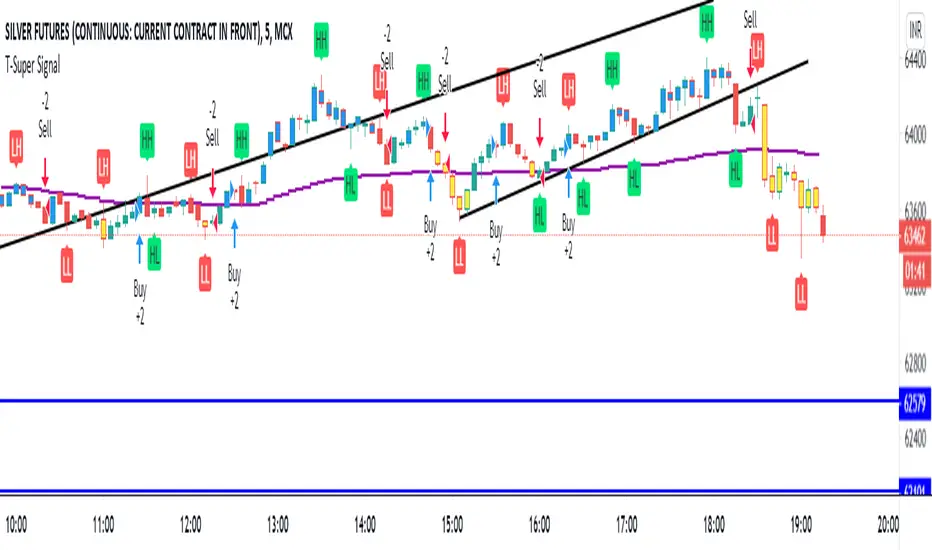
T-Super Signal
Hi Friends,
This Indicator is combination WMA, RSI, Vwap. Buy and Sell Signal generated through WMA and Bar color changes through RSI values.
Vwap: if we find prices below the Vwap then we have to look for BUY signals and if we find prices below the Vwap then we look for Sell Signals.
Its difficult how we came to know that now the prices will Vwap its simple, in this indicator your Higher High and Lower Low signals.
You can easily on chart that HH & HL are found means Vwap will be broke downwards.
Carmarilla Pivots points are also included in this for better to find Long and Short Targets.
Indicator works on 5min.
Отказ от ответственности
Все виды контента, которые вы можете увидеть на TradingView, не являются финансовыми, инвестиционными, торговыми или любыми другими рекомендациями. Мы не предоставляем советы по покупке и продаже активов. Подробнее — в Условиях использования TradingView.