OPEN-SOURCE SCRIPT
ka66: Asher Magical Midpoint
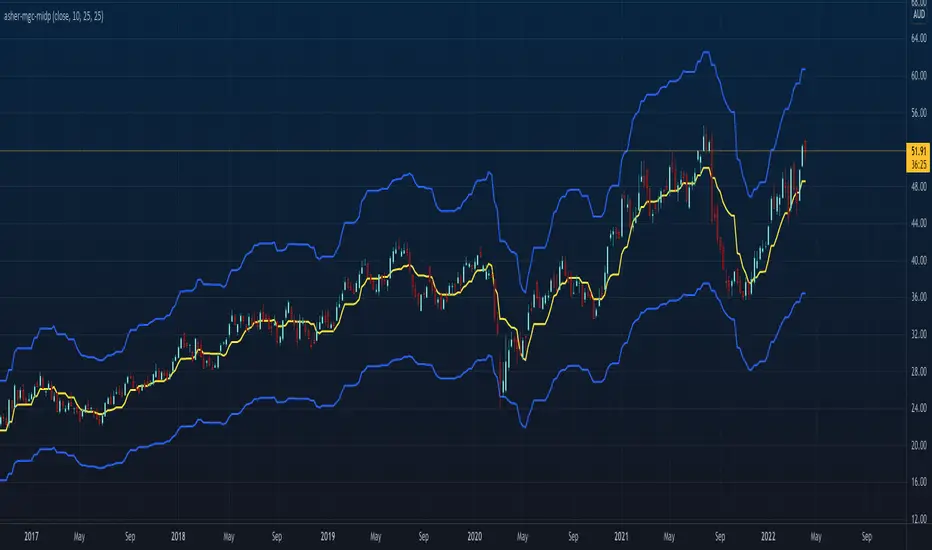
This Support and Resistance and Trend Channel indicator is based on:
Stocks & Commodities V. 40:13 (20–22): Magical Midpoint Of 52-Week High & Low by Ketan Asher
This indicator seems to work better over higher timeframes, as the article suggested. It also seems to work better with stocks, not so much with currencies. This may be due to the crowd psychology which considers 52-week marks as significant in stocks. The indicator allows configurable lookback periods, and band percentage widths.
Since it's very much price-driven, a useful context for this is some weekly breakout above the midpoint and indication of a rising trend. The bands at the point of breakout can be used as a profit taking point, partial or full, depending on your system.
The article suggests a stop loss at the last week's low, or below the midpoint line depending on the trader's risk appetite.
Скрипт с открытым кодом
В истинном духе TradingView автор этого скрипта опубликовал его с открытым исходным кодом, чтобы трейдеры могли понять, как он работает, и проверить на практике. Вы можете воспользоваться им бесплатно, но повторное использование этого кода в публикации регулируется Правилами поведения. Вы можете добавить этот скрипт в избранное и использовать его на графике.
Отказ от ответственности
Все виды контента, которые вы можете увидеть на TradingView, не являются финансовыми, инвестиционными, торговыми или любыми другими рекомендациями. Мы не предоставляем советы по покупке и продаже активов. Подробнее — в Условиях использования TradingView.