OPEN-SOURCE SCRIPT
Volume Based Support & Resistance
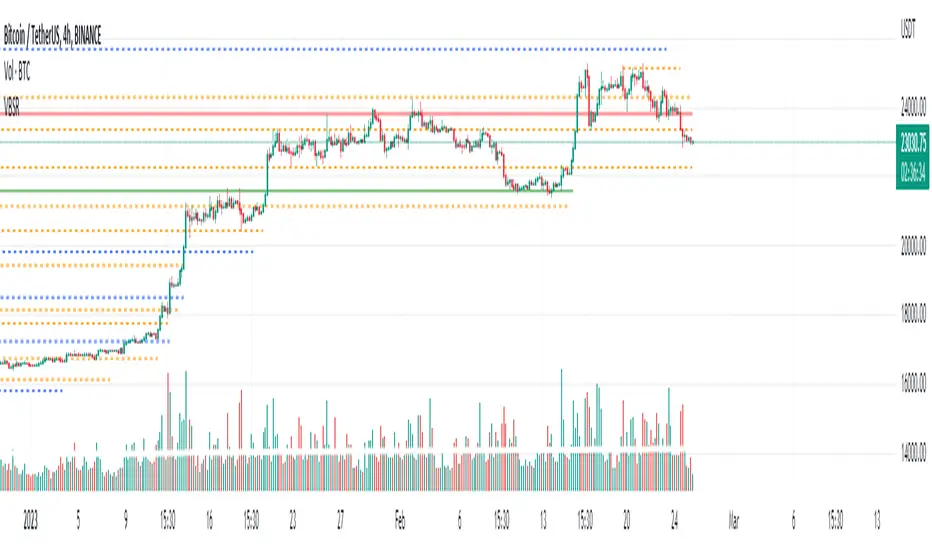
This script uses the Volume of each candle to find support and resistances on the whole visible chart. There is a single easy to use setting that is the Distance between major S/R lines which is 10% for the default and better for Daily timeframe. If you set a lower number, for example 5% then there will be more lines on the chart which is better for lower time frames and higher number like 20% maybe better for weekly timeframes.
It is developed based on using for Bitcoin daily timeframe, but it can be used for any symbol on any timeframe with the proper settings.
The limitation is the number of visible candles which the data and S/R lines are calculated based on them (if the previous data was within the same price range and if not, there is no issue).
Also, this code is a good learning example of using arrays and lines together in the trading view's pine script.
Скрипт с открытым кодом
В истинном духе TradingView автор этого скрипта опубликовал его с открытым исходным кодом, чтобы трейдеры могли понять, как он работает, и проверить на практике. Вы можете воспользоваться им бесплатно, но повторное использование этого кода в публикации регулируется Правилами поведения. Вы можете добавить этот скрипт в избранное и использовать его на графике.
nfa & dyor
Invest Smart!
Invest Smart!
Отказ от ответственности
Все виды контента, которые вы можете увидеть на TradingView, не являются финансовыми, инвестиционными, торговыми или любыми другими рекомендациями. Мы не предоставляем советы по покупке и продаже активов. Подробнее — в Условиях использования TradingView.