OPEN-SOURCE SCRIPT
3 Auto Fibonacci Retracements
Обновлено

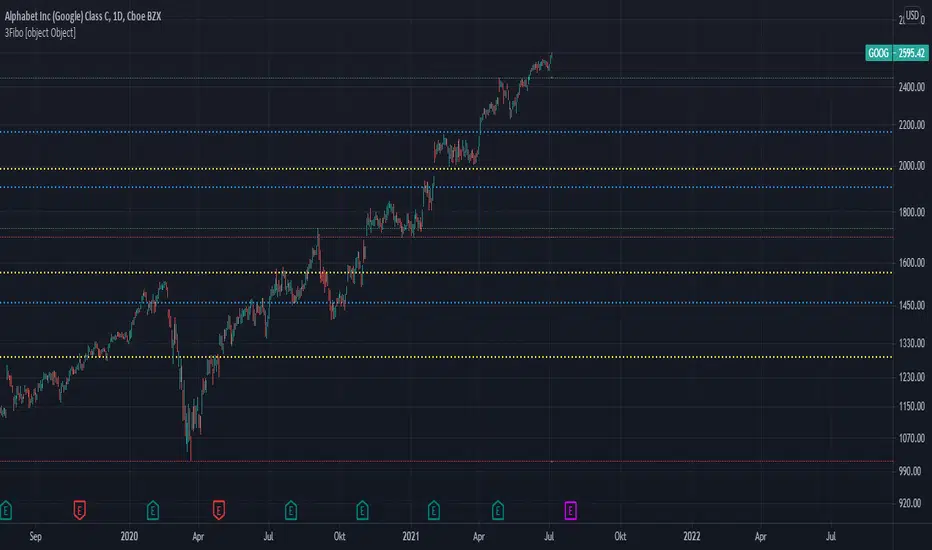
The Indicator displays 3 different Auto Fibonacci Retracements with top, bottom, the 0.618 and 0.382 levels.
Also it displays 3 Moving Averages with the same length as the AutoFibos.
If the MA over the 0.618 level it colors itself yellow, if between 0.618 ans 0.382 white and under 0.382 blue.
The green lines are the top of the AutoFibos, red lines the bottom, blue lines are resistance/supports and yellow lines are stronger resistance/supports.
Информация о релизе
The Indicator displays 3 different Auto Fibonacci Retracements with top, bottom, the 0.618 and 0.382 levels.Also it displays 3 Moving Averages with the same length as the AutoFibos.
If the MA over the 0.618 level it colors itself yellow, if between 0.618 ans 0.382 white and under 0.382 blue.
The green lines are the top of the AutoFibos, red lines the bottom, blue lines are resistance/supports and yellow lines are stronger resistance/supports.
Скрипт с открытым кодом
В истинном духе TradingView автор этого скрипта опубликовал его с открытым исходным кодом, чтобы трейдеры могли понять, как он работает, и проверить на практике. Вы можете воспользоваться им бесплатно, но повторное использование этого кода в публикации регулируется Правилами поведения. Вы можете добавить этот скрипт в избранное и использовать его на графике.
Отказ от ответственности
Все виды контента, которые вы можете увидеть на TradingView, не являются финансовыми, инвестиционными, торговыми или любыми другими рекомендациями. Мы не предоставляем советы по покупке и продаже активов. Подробнее — в Условиях использования TradingView.