OPEN-SOURCE SCRIPT
Weekday Change & Volume Average Table
Обновлено
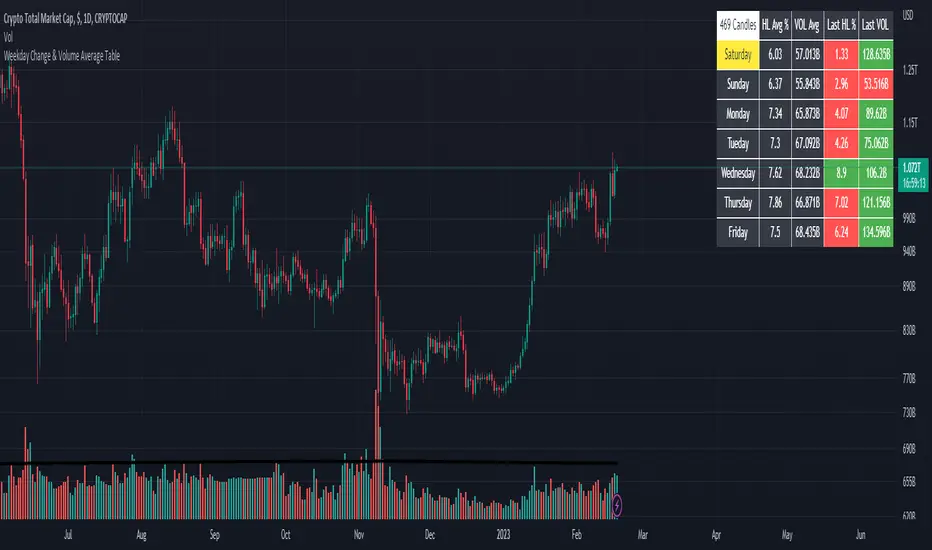
Having a reference point for comparing with current data has always been an important task in market analysis. This script tried to give a better understanding based on weekdays.
This script shows that in the current ticker, what is the average movement of the price (High-Low) and volume for each weekday. Depending on the market and the exchange it should be different.
The Interesting point is that, for example in
 BTCUSDT, on Saturday and Sunday, volume is about 30% less and the price movement is about 20% less.
The script can be used on any timeframe and any symbol, just remember that the data shown is based on the candles on the chart, so it is different also based on your tradingview's account since Historical bars available for Basic is 5K, Pro & Pro+ is 10K and Premium is 20K; And in lower timeframes it is calculating more recent data.
This script shows that in the current ticker, what is the average movement of the price (High-Low) and volume for each weekday. Depending on the market and the exchange it should be different.
The Interesting point is that, for example in
The script can be used on any timeframe and any symbol, just remember that the data shown is based on the candles on the chart, so it is different also based on your tradingview's account since Historical bars available for Basic is 5K, Pro & Pro+ is 10K and Premium is 20K; And in lower timeframes it is calculating more recent data.
Информация о релизе
Now it can be used on forex pairs too by updating the usage of last function on each day's array.Скрипт с открытым кодом
В истинном духе TradingView автор этого скрипта опубликовал его с открытым исходным кодом, чтобы трейдеры могли понять, как он работает, и проверить на практике. Вы можете воспользоваться им бесплатно, но повторное использование этого кода в публикации регулируется Правилами поведения. Вы можете добавить этот скрипт в избранное и использовать его на графике.
nfa & dyor
Invest Smart!
Invest Smart!
Отказ от ответственности
Все виды контента, которые вы можете увидеть на TradingView, не являются финансовыми, инвестиционными, торговыми или любыми другими рекомендациями. Мы не предоставляем советы по покупке и продаже активов. Подробнее — в Условиях использования TradingView.