OPEN-SOURCE SCRIPT
Time based Insights [Digit23]
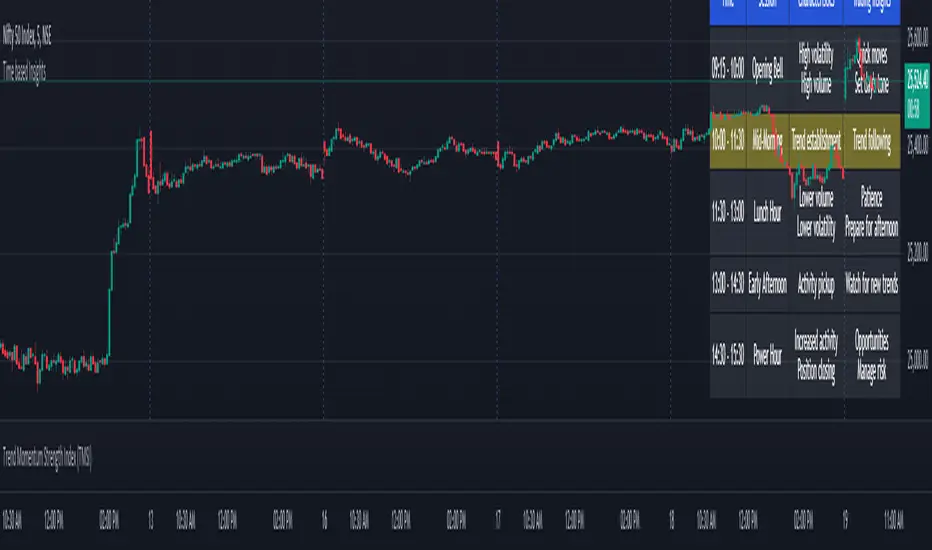
The NSE Trading Time Insights indicator is a powerful tool designed for traders on the National Stock Exchange (NSE) of India. It provides a comprehensive overview of different trading sessions throughout the day, offering valuable insights into market characteristics and potential trading strategies for each time period.
Key Features:
1. Dynamic Session Display: The indicator automatically detects the current trading session and highlights it in the table.
2. Customizable Table: Users can choose to display either a full table showing all sessions or focus on the current session only.
3. User-Editable Content: Time ranges, session characteristics, and trading insights are fully customizable by the user.
4. Visual Customization: Table position and color scheme can be adjusted to suit individual preferences.
5. Market Status Indicator: Clearly shows when the market is closed.
Sessions Covered:
1. Opening Bell
2. Mid-Morning
3. Lunch Hour
4. Early Afternoon
5. Power Hour
For each session, the indicator displays:
- Time Range
- Session Name
- Market Characteristics
- Trading Insights
Customization Options:
- Table Position: Choose from top-left, top-right, bottom-left, or bottom-right of the chart.
- Color Scheme: Customize colors for header, cells, highlighting, and market closed status.
- Session Details: Edit time ranges, characteristics, and trading insights for each session.
Usage:
This indicator is particularly useful for:
1. New traders learning about intraday market dynamics on the NSE.
2. Experienced traders looking for a quick reference of session characteristics.
3. Traders developing or refining time-based trading strategies.
4. Anyone seeking to understand the typical flow of the trading day on the NSE.
Note:
The indicator uses the chart's time to determine the current session. Ensure your chart is set to the correct time zone for accurate results.
Disclaimer:
This indicator is for informational purposes only. The provided insights and characteristics are general in nature and may not reflect current market conditions. Always conduct your own analysis and risk assessment before making trading decisions.
Скрипт с открытым кодом
В истинном духе TradingView автор этого скрипта опубликовал его с открытым исходным кодом, чтобы трейдеры могли понять, как он работает, и проверить на практике. Вы можете воспользоваться им бесплатно, но повторное использование этого кода в публикации регулируется Правилами поведения. Вы можете добавить этот скрипт в избранное и использовать его на графике.
Отказ от ответственности
Все виды контента, которые вы можете увидеть на TradingView, не являются финансовыми, инвестиционными, торговыми или любыми другими рекомендациями. Мы не предоставляем советы по покупке и продаже активов. Подробнее — в Условиях использования TradingView.